Preview image. Unlock full-res
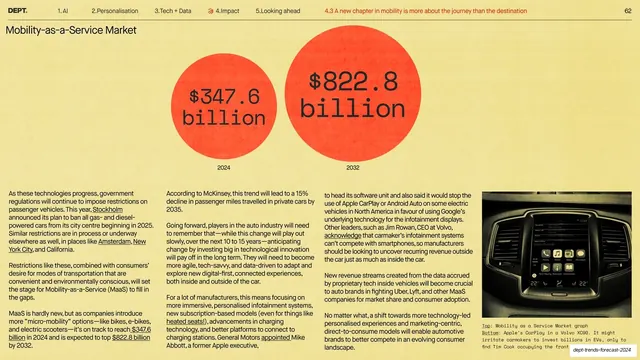
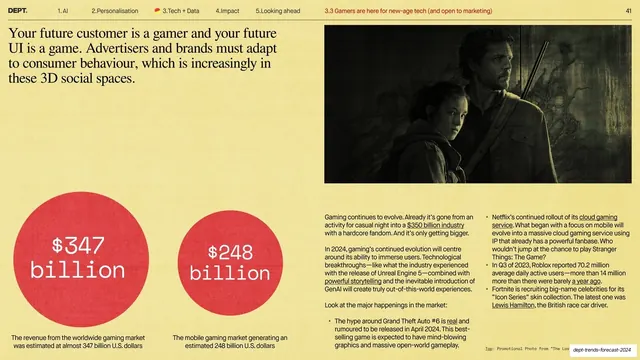
Two orange circles compare 2024 and 2032 market values above three columns of body copy, with a small car-infotainment photo at the lower right.
Summary
A market-sizing slide: two orange circles, the right one larger, hold "$347.6 billion" (2024) and "$822.8 billion" (2032) to show growth, with three columns of body copy below and a small infotainment photo at the lower right.
Visual description
Warm yellow background with the running header on a hairline rule and the active sub-section in red. The title "Mobility-as-a-Service Market" sits top-left. Two orange discs sit side by side near the top: a smaller one labeled "$347.6 billion / 2024" and a larger one labeled "$822.8 billion / 2032," the size difference encoding the growth. The lower two-thirds is three columns of small dark sans-serif body copy with underlined links. A small color photograph of a car's central infotainment touchscreen sits at the lower-right corner with a monospace caption above it.
Key takeaway
Sizing the two circles to their values so the comparison is legible before you read a number: the bar-chart logic done with circles, keeping the deck's stat-circle motif consistent. Using a real product photo (the infotainment screen) grounds an abstract market figure.
Reuse notes
A reusable before/after or projection template for any market-size or forecast slide. The proportional-circle device only reads honestly if the sizes roughly track the numbers. Keep the circle color and label format matching the deck's other stat slides.
From this deck: Mobility-as-a-Service market growth circles
View deck



























More like this


Keep what you find
A free account saves references to boards and can send you a weekly email of picks based on what you save.
To see every result, go Pro.