
Preview image. Unlock full-res
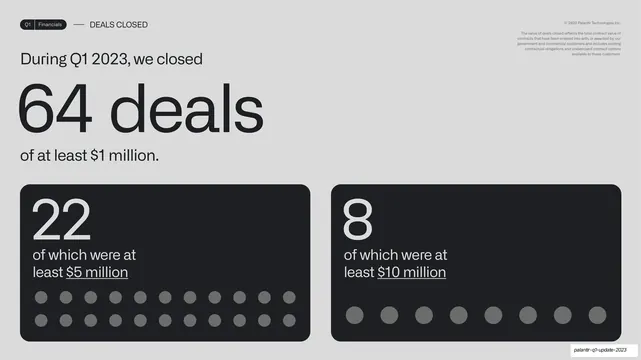
An oversized "64 deals" statement on the upper left, with two dark stat cards below showing 22 and 8 larger deals, each visualized as a row of dots.
Summary
A deals-closed slide: an oversized "64 deals" headline at upper left, with two dark stat cards beneath showing 22 and 8 larger deals, each tallied as a row of dots.
Visual description
A light grey slide. Running header reads "Q1 | Financials" and "DEALS CLOSED"; a small grey definitional note sits top-right. The upper-left reads "During Q1 2023, we closed" above an enormous dark "64 deals", then "of at least $1 million". Below sit two rounded near-black cards. Left card: a large "22" over "of which were at least $5 million" (underlined), with two rows of grey dots beneath as a unit tally. Right card: a large "8" over "of which were at least $10 million" (underlined), with a single row of eight grey dots. The dot counts visualize the figures literally.
Key takeaway
The giant headline number paired with literal dot tallies in the supporting cards, the dots turning abstract counts into something countable at a glance. Underlining the dollar threshold inside each card keeps the qualifier legible.
Reuse notes
A memorable way to present deal or unit counts where the magnitude matters. The dot-array works best for counts under roughly thirty; beyond that the dots stop being readable. Pairs the deck's big-number style with a light infographic touch.
From this deck: 64 deals closed big-number slide
View deck



















More like this








Keep what you find
A free account saves references to boards and can send you a weekly email of picks based on what you save.
To see every result, go Pro.