Preview image. Unlock full-res
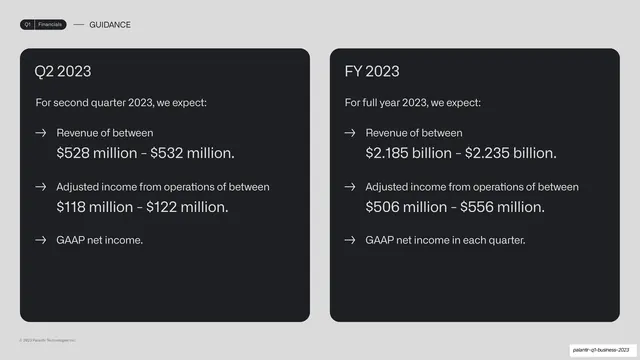
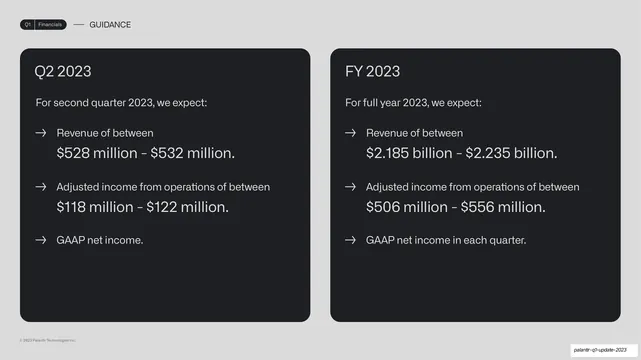
Two side-by-side dark cards for Q2 2023 and FY 2023 guidance, each an arrow-bulleted list with the revenue and income ranges set in large type.
Summary
The guidance slide: two side-by-side dark cards, Q2 2023 and FY 2023, each an arrow-bulleted list with the revenue and income ranges set large.
Visual description
A light grey slide. Running header reads "Q1 | Financials" and "GUIDANCE". Two equal rounded near-black cards sit side by side. Left card titled "Q2 2023" opens "For second quarter 2023, we expect:" then three arrow bullets: revenue of $528 million to $532 million, adjusted income from operations of $118 million to $122 million, and GAAP net income, with the dollar ranges set in a larger light grey size than the label lines. Right card titled "FY 2023" mirrors the structure with full-year figures ($2.185 billion to $2.235 billion, $506 million to $556 million, GAAP net income each quarter). Arrow glyphs lead each bullet.
Key takeaway
Pairing near-term and full-year outlook as two matching cards, with the actual figures stepped up in size beneath smaller descriptor lines so the numbers are the takeaway. The arrow bullets tie back to the highlights slide's visual language.
Reuse notes
A clean outlook or targets slide for any plan, forecast, or roadmap with both a short and long horizon. Keep the two cards structurally identical so the periods compare directly. Size the figures, not the labels, to lead the eye to the commitments.
From this deck: Q2 and FY 2023 guidance two-up
View deck













More like this




Keep what you find
A free account saves references to boards and can send you a weekly email of picks based on what you save.
To see every result, go Pro.