Preview image. Unlock full-res
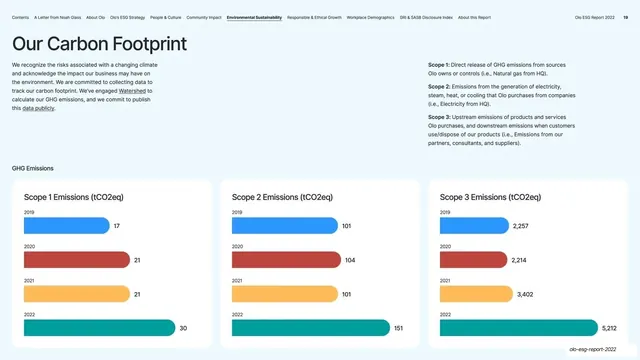
Light report page on GHG emissions with an oversized headline, a Scope 1/2/3 definitions column, and three white cards of year-over-year horizontal bar charts.
Summary
An emissions page from Olo's ESG report. An oversized "Our Carbon Footprint" headline tops an intro paragraph and a Scope 1/2/3 definitions column, with three white cards below charting Scope 1, 2, and 3 emissions across four years.
Visual description
Pale blue (#EAF1FB) background. A thin top navigation lists every report section in small grey caps, with "Environmental Sustainability" active; "Olo ESG Report 2022" and the page number 19 sit at the right. A very large near-black "Our Carbon Footprint" headline runs across the upper left. Below it, a left body paragraph about climate risk and committing to publish GHG data, and a right column defining Scope 1, Scope 2, and Scope 3 in bold-labeled paragraphs. A small "GHG Emissions" label introduces three equal white rounded cards: "Scope 1 / 2 / 3 Emissions (tCO2eq)", each with four labeled horizontal bars (2019 blue, 2020 rust-red, 2021 amber, 2022 teal) and a value to the right of each bar (Scope 3 rising from 2,257 to 5,212).
Key takeaway
The discipline of one fixed bar-chart card repeated three times so three different metrics read as one comparable system, with a consistent year-to-color key (blue, rust, amber, teal) that the whole report reuses. The big editorial headline over dense reporting keeps a data page from feeling like a spreadsheet.
Reuse notes
A strong template for any ESG, impact, or annual report page that has to present several parallel multi-year metrics. The three-card-of-bars pattern scales to other paired KPIs. Needs the rest of the report to reuse the same year-color key for the comparison to pay off.
From this deck: Our Carbon Footprint GHG emissions cards
View deck








More like this





Keep what you find
A free account saves references to boards and can send you a weekly email of picks based on what you save.
To see every result, go Pro.