Preview image. Unlock full-res
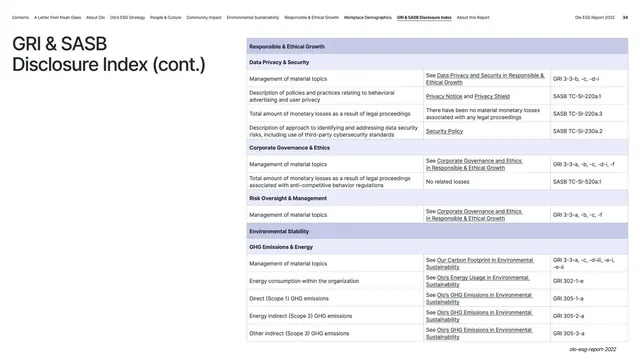
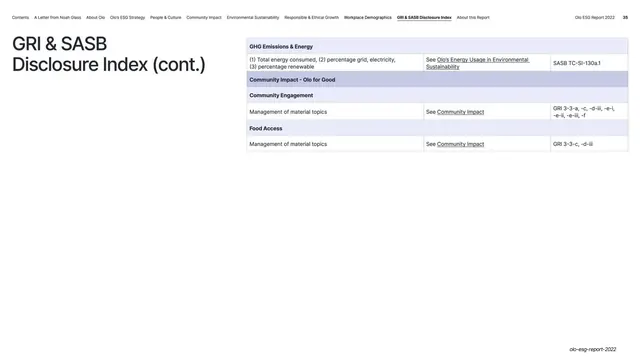
Light disclosure-index page continuing the topic-grouped reference table through Community Impact, GHG Emissions & Energy, with bold blue section labels banding the rows.
Summary
A continuation of the topic-grouped disclosure index, banding the three-column reference table through Community Impact and GHG Emissions & Energy with bold blue section headers.
Visual description
Pale blue background, persistent top navigation (page 34). A small "GRI & SASB Disclosure Index (cont.)" heading sits top-left. The same "Disclosure / Location and/or Information / GRI or SASB Reference" table continues with faint zebra rows, segmented by full-width blue bold section labels, "Community Impact", then "GHG Emissions & Energy". Rows pair a disclosure (energy consumed, percentage grid electricity, direct/indirect GHG emissions) with "See [section]" links or proxy/10-K references and codes like GRI 305-1 and SASB metric IDs. A repeated left "Management of material topics" column heads each group.
Key takeaway
The consistency of the grouped-index system across several pages: the blue topic bands and the fixed column grid never change, so a reader moving through Community Impact into Emissions & Energy stays oriented. It proves an appendix can be both exhaustive and navigable.
Reuse notes
Directly continues the prior index pages; together they model a multi-page, topic-banded GRI/SASB index. Keep the column headers, zebra striping, and colored group-label style identical across the run. Note: the gallery caption labels this slide as report methodology, but the visible content is the emissions/energy disclosure index.
From this deck: Disclosure Index emissions and energy table
View deck




















More like this




Keep what you find
A free account saves references to boards and can send you a weekly email of picks based on what you save.
To see every result, go Pro.