Preview image. Unlock full-res
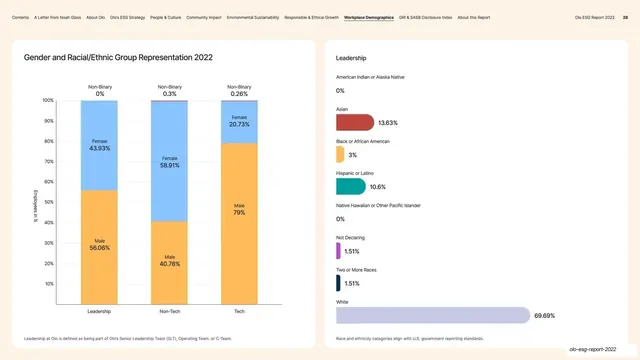
Light demographics page with a 100% stacked-bar gender chart card on the left and a racial/ethnic leadership horizontal-bar list card on the right.
Summary
A two-card demographics page: a 100% stacked-bar chart of gender by function (Leadership, Non-Tech, Tech) on the left and a racial/ethnic representation list for Leadership on the right.
Visual description
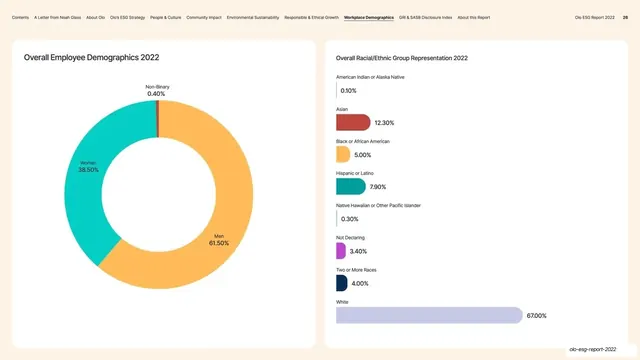
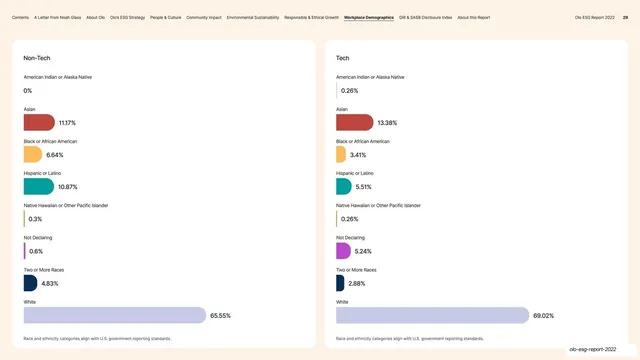
Warm off-white background, persistent top navigation (page 28). The left rounded white card, "Gender and Racial/Ethnic Group Representation 2022", holds three full-height stacked bars on a percentage axis, one each for Leadership, Non-Tech, and Tech, segmented into Male (amber), Female (blue), and a thin Non-Binary cap, with each segment's percentage labeled inside. A small note defines Leadership as the Senior Leadership Team. The right rounded white card, "Leadership", repeats the nine-row racial/ethnic horizontal-bar list pattern (American Indian through White at 69.69%), each bar scaled and labeled with its percentage, closing with an alignment-with-US-standards note.
Key takeaway
Pairing a 100% stacked-bar comparison (how gender mix shifts across Leadership vs Tech vs Non-Tech) with the same ranked bar-list component used elsewhere, so a reader can cross-read function and ethnicity on one page. Holding the bars to full height with inline labels makes the proportion comparison immediate.
Reuse notes
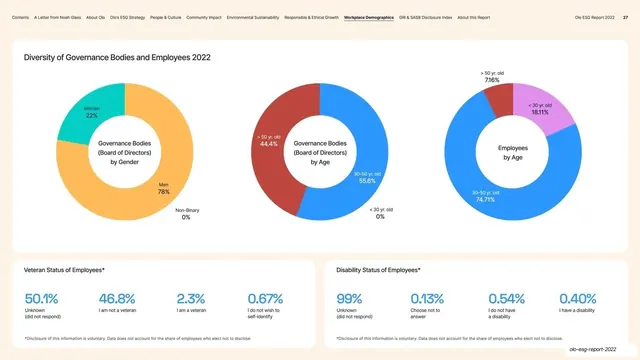
The stacked-bar-by-category card is reusable wherever you compare composition across a few groups (departments, regions, cohorts). The racial/ethnic bar list is a recurring component across this report's demographic pages; reuse it verbatim for consistency. Keep both in the standard white card.
From this deck: Gender Representation stacked bars and Leadership list
View deck




More like this





Keep what you find
A free account saves references to boards and can send you a weekly email of picks based on what you save.
To see every result, go Pro.