Preview image. Unlock full-res
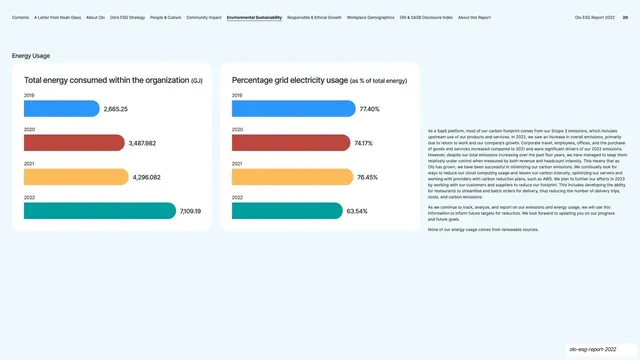
Light energy-usage page with two pastel rounded cards of four-year horizontal bar charts beside a tall column of explanatory body copy.
Summary
An energy page pairing two pastel data cards, total energy consumed and percentage grid electricity, each a four-year bar chart, with a tall right column of explanatory body copy.
Visual description
Pale blue background and the same persistent top navigation (page 20). A small "Energy Usage" label sits top-left. Two side-by-side rounded cards in very light tints carry the charts: left "Total energy consumed within the organization (GJ)" and right "Percentage grid electricity usage (as % of total energy)". Each card stacks four labeled horizontal bars by year using the report's fixed key (2019 blue, 2020 rust, 2021 amber, 2022 teal), with the value printed to the right (left card climbing to 7,109.19; right card showing 77.40% down to 63.54%). To the right, a long single-column paragraph explains the Scope 3 emissions context and a closing line, "None of our energy usage comes from renewable sources."
Key takeaway
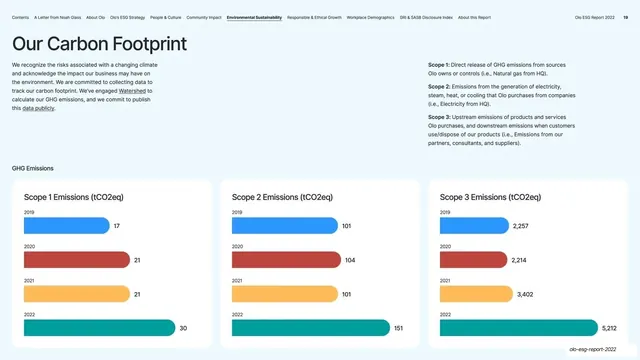
Reusing the exact bar-card component from the previous page so energy reads as part of the same data family. Setting the bar fills in pale pastel tints (rather than fully saturated) keeps a dense two-card page calm. The blunt closing disclosure line is a credible, non-greenwashed tone worth copying.
Reuse notes
Good for report pages that pair two related metrics and need room for a substantial narrative beside them. The pastel-fill variant of the bar card suits softer, text-heavy spreads; the saturated variant suits headline KPI pages. Reuse the year-color key for cross-page consistency.
From this deck: Energy Usage data cards
View deck


More like this







Keep what you find
A free account saves references to boards and can send you a weekly email of picks based on what you save.
To see every result, go Pro.