
Preview image. Unlock full-res
Guideline page showcasing the branded data-viz system: pie, donut, and bar charts plus oversized callout stats in violet, mist, and white on a light card.
Summary
A guideline page defining the data-visualization system: charts and call-out statistics built from the primary palette for dense but legible information design.
Visual description
White page, running header (page 58, "Visual Elements / Data Visualization"). The left column holds the "Data Visualization" heading, body copy, and a "Considerations" bullet list (Cobalt, Inkwell, Mist, and White as primary chart colors; call-out numbers in DS Indigo Light Cobalt). The right two-thirds is a large rounded off-white card densely packed with example charts: a big violet pie chart with a glassmorphic "376 respondents" call-out card and a "62%" pill, a set of stacked horizontal bar charts, a 2x2 grid of donut gauges labeled NO / NEUTRAL / YES / DON'T KNOW, four dark and light mini stat cards along the bottom, and a right column of oversized percentage call-outs (37%, 12%, 7%). All charts use tints of violet plus mist and white.
Key takeaway
A complete, restrained chart palette (a few violet tints plus mist and white) that keeps dense dashboards legible and unmistakably on-brand. Pairing big call-out numbers in light-weight type with small supporting charts balances impact and detail.
Reuse notes
Directly reusable as the charting spec for reports, ePubs, decks, and product dashboards. The discipline of limiting chart colors to brand tints is the transferable lesson. Subtle glassmorphic strokes on stat cards add depth but should never obscure the data.
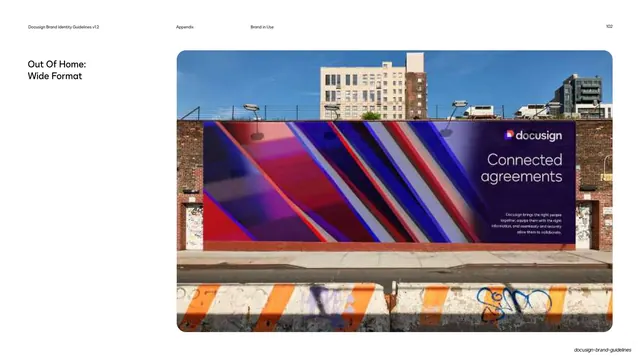
From this deck: Docusign data visualization system
View deck












More like this






Keep what you find
A free account saves references to boards and can send you a weekly email of picks based on what you save.
To see every result, go Pro.