Preview image. Unlock full-res
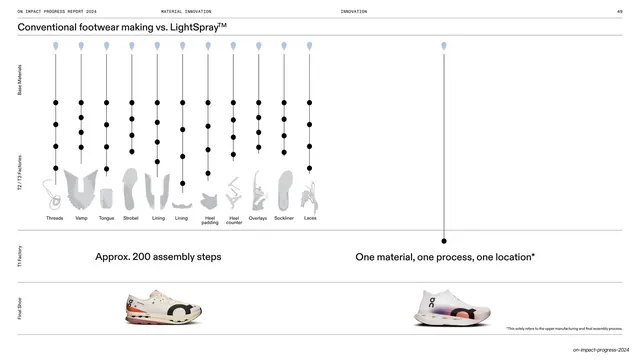
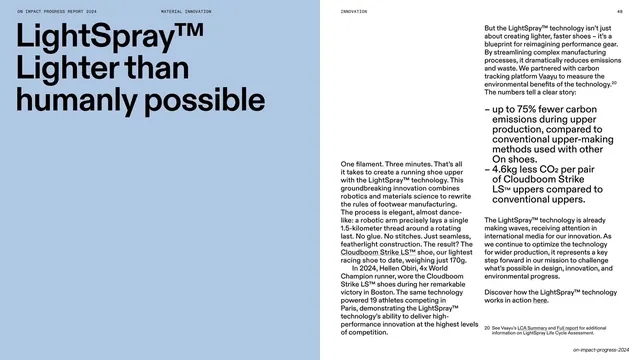
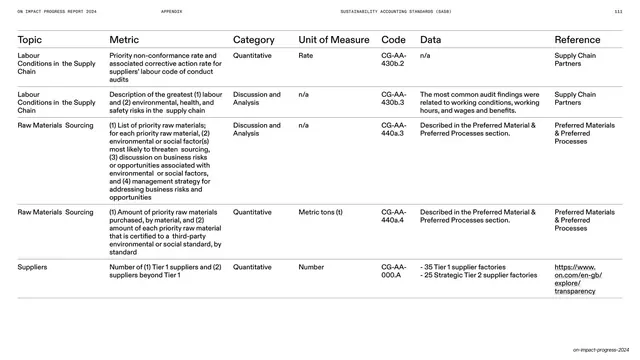
Side-by-side process diagram contrasting roughly 200 conventional shoe-assembly steps with LightSpray's single material, process and location.
Summary
A two-column process diagram putting conventional footwear assembly (about 200 steps, many components and factories) next to LightSpray's single material, single process, single location.
Visual description
White background, tiny running header and "49" page number, with a small "Conventional footwear making vs. LightSpray" title on a rule. The left column is a dense flow: eleven vertical strands of dotted nodes descend from pale-blue droplet markers through stage bands labelled at the left edge (Base Materials, T2/T3 Factories), each strand ending in a faint grey component icon (Threads, Vamp, Tongue, Strobel, Lining, Heel padding, Heel counter, Overlays, Sockliner, Laces), converging to a T1 Factory node and the line "Approx. 200 assembly steps". The right column is a single strand dropping to one node and "One material, one process, one location*". Both columns resolve at the bottom into a "Final Shoe" row showing a finished On shoe photo each. A small footnote sits bottom right.
Key takeaway
Visualizing process complexity as literal line count: a thicket of dotted strands versus a single clean line makes "200 steps vs one" instantly legible without reading a number. Component ghost-icons and a final-shoe row anchor the abstraction in the real product.
Reuse notes
A strong template whenever you need to dramatize old-way-vs-new-way complexity, step counts, or consolidation. The strand metaphor scales to any multi-step process. Needs careful alignment so the many dotted lines stay clean; works best in monochrome with one accent for the start markers.
From this deck: Conventional vs LightSpray process comparison
View deck


























More like this



Keep what you find
A free account saves references to boards and can send you a weekly email of picks based on what you save.
To see every result, go Pro.