Preview image. Unlock full-res
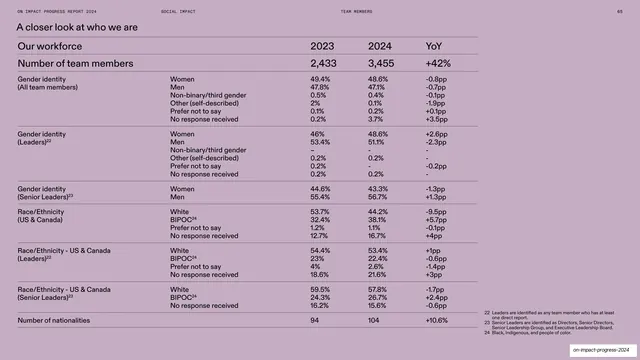
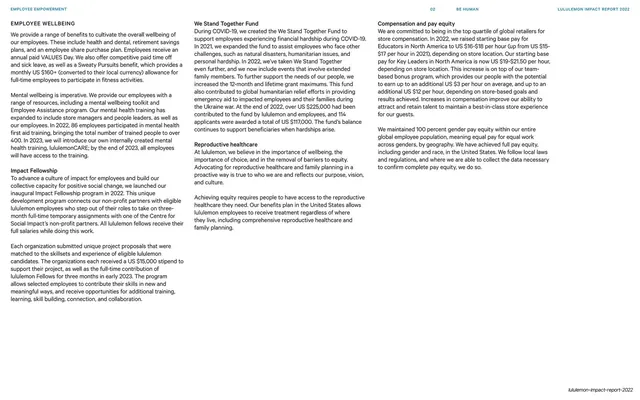
Dense lavender workforce demographics table comparing 2023 and 2024 figures with a year-over-year delta column and footnotes.
Summary
A data-dense lavender slide titled "A closer look at who we are", presenting workforce demographics across grouped rows with 2023, 2024, and year-over-year columns.
Visual description
Soft lavender background with the standard hairline running header and page "65". A small black title "A closer look at who we are" sits top-left. Below, a wide table groups workforce metrics: a section head "Our workforce" with column heads "2023 / 2024 / YoY", a highlighted "Number of team members" row (2,433 / 3,455 / +42%), then grouped categories (Gender identity, Race/Ethnicity, by all members / leaders / senior leaders) each broken into sub-rows with percentages and signed percentage-point deltas. Thin rules separate the groups; superscript footnotes (22-24) run down the lower-right with their definitions. Footer credit bottom-right.
Key takeaway
Structuring a demographics table as grouped blocks (category, then breakdown) with a dedicated signed-delta column so movement reads at a glance, plus superscript footnotes carrying the definitional fine print out of the table body.
Reuse notes
The reference layout for DEI, headcount, or any year-over-year metric disclosure. The tinted ground softens an otherwise austere data wall. Heavy on numbers, so it needs careful column alignment and a legible footnote zone; not for a glanceable summary.
From this deck: Workforce demographics data table (lavender)
View deck








































More like this


Keep what you find
A free account saves references to boards and can send you a weekly email of picks based on what you save.
To see every result, go Pro.