Preview image. Unlock full-res
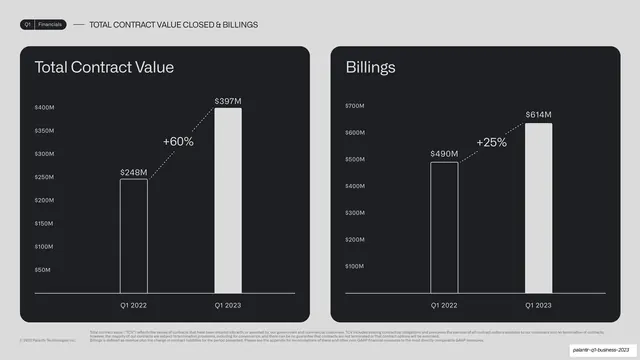
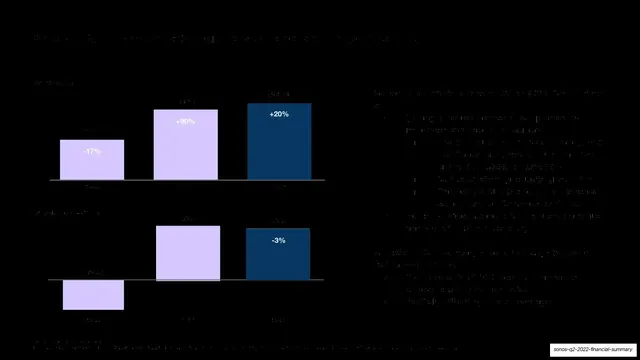
Two side-by-side dark chart cards for Total Contract Value and Billings, each a two-bar year-over-year chart with a dotted percent callout.
Summary
A bookings two-up: side-by-side dark chart cards for Total Contract Value and Billings, each a two-bar year-over-year chart with a dotted percent callout.
Visual description
A light grey slide in the established two-up layout. Running header reads "Q1 | Financials" and "TOTAL CONTRACT VALUE CLOSED & BILLINGS". Left card, "Total Contract Value", plots Q1 2022 ($248M, outlined) to Q1 2023 ($397M, solid) with a steep dotted "+60%" callout. Right card, "Billings", plots Q1 2022 ($490M) to Q1 2023 ($614M) with a dotted "+25%" callout. White bars, monospace axis labels. Small grey footnotes define TCV and billings at the bottom.
Key takeaway
The same two-bar comparison card used yet again, here for forward-looking bookings metrics, so the entire financials section reads as one coherent chart family. A steeper dotted callout line naturally signals a larger percentage jump.
Reuse notes
Reuse for any pair of pipeline or bookings metrics. By this point the repetition is the strength: the audience reads each new chart instantly because the form never changes. Keep definitional footnotes for non-standard measures.
From this deck: Total contract value and billings two-up
View deck














More like this





Keep what you find
A free account saves references to boards and can send you a weekly email of picks based on what you save.
To see every result, go Pro.