Preview image. Unlock full-res
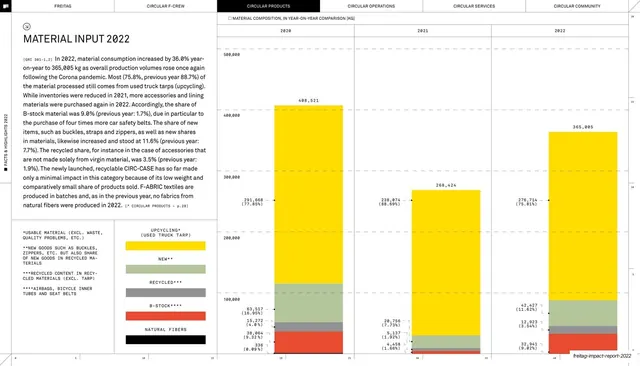
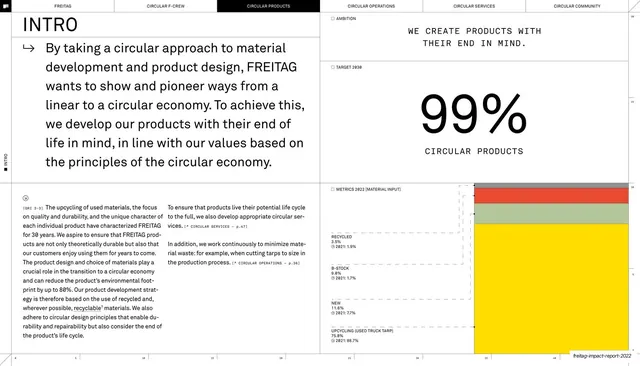
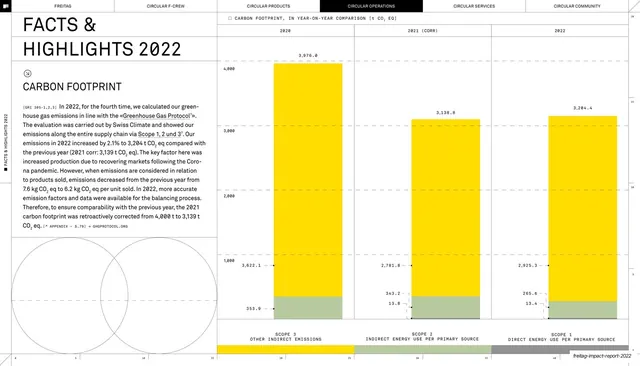
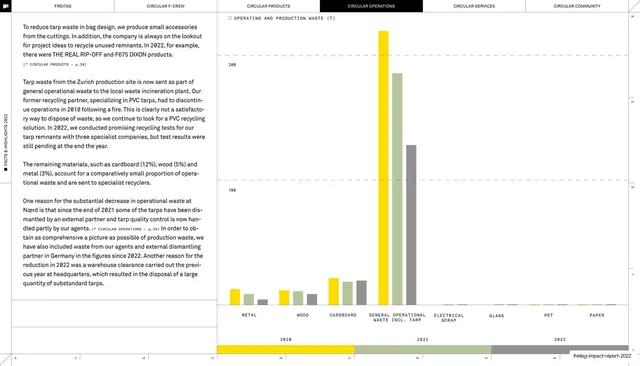
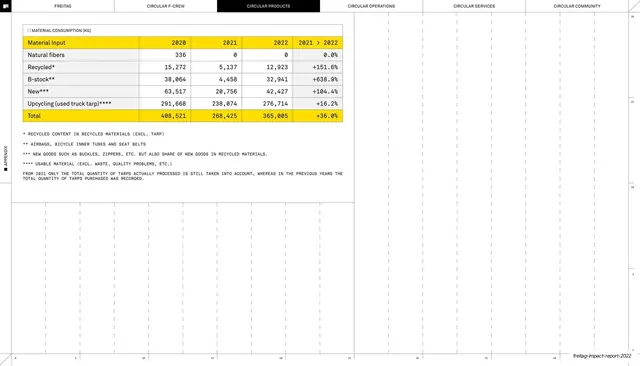
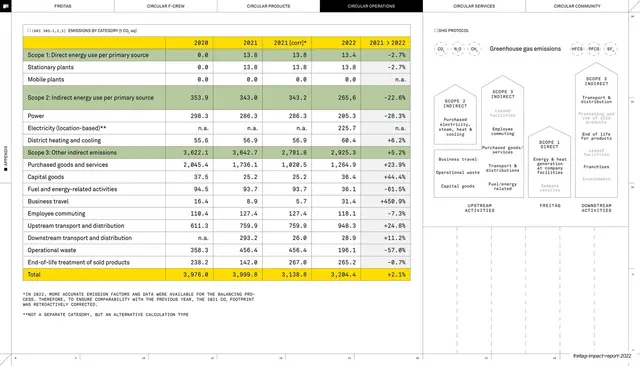
Full data page with a left explanatory column and legend, plus three tall year-on-year stacked bars charting material composition in kg for 2020, 2021 and 2022.
Summary
A material-input data page: a "MATERIAL INPUT 2022" headline and explanatory body copy with a color legend fill the left third, and the right two-thirds is a year-on-year stacked column chart comparing 2020, 2021 and 2022 material composition in kilograms.
Visual description
The six-tab header (CIRCULAR PRODUCTS active) sits on a hairline; the rotated margin label is present. The left column has a serif headline, a monospace GRI reference, justified body copy, and a five-row color legend (UPCYCLING yellow, NEW grey, RECYCLED grey-green, B-STOCK red, NATURAL FIBERS black) with asterisked notes. The right area plots three tall stacked bars on a faint dashed value axis labelled up to 500,000, each bar dominated by a yellow upcycling block and topped with thin coloured segments, every segment annotated in small monospace with absolute kg and percentage plus prior-year figures. Column totals (408,521 / 268,424 / 365,005) sit above each bar. Numbered ticks rule the bottom.
Key takeaway
A textbook editorial chart: the legend and narrative live in a dedicated text column so the plot stays clean, and every segment is labelled directly with both value and share rather than relying on the axis. Keeping one color (yellow) as the dominant story and reserving the others for the thin top bands makes a multi-year, multi-category dataset instantly legible.
Reuse notes
Directly reusable for the quantitative pages of any sustainability, ESG, or annual report that compares a metric across years. The pattern of a text-and-legend column beside a fully-labelled stacked chart scales to most part-to-whole time series. Limit the palette to four or five fixed category colors and label segments inline so the chart survives at print size.
From this deck: Material input 2022 year-on-year stacked bar chart
View deck

More like this



Keep what you find
A free account saves references to boards and can send you a weekly email of picks based on what you save.
To see every result, go Pro.