
Preview image. Unlock full-res
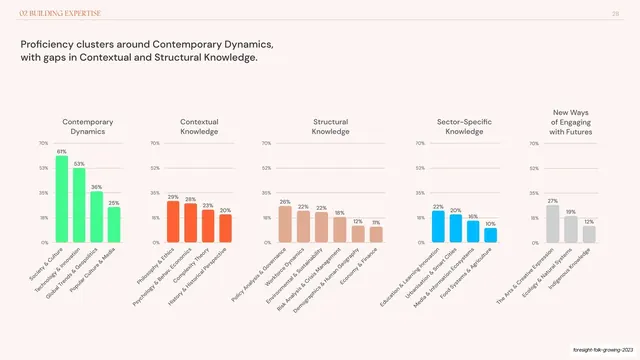
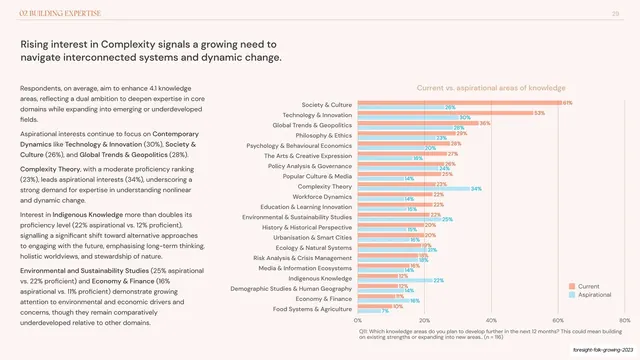
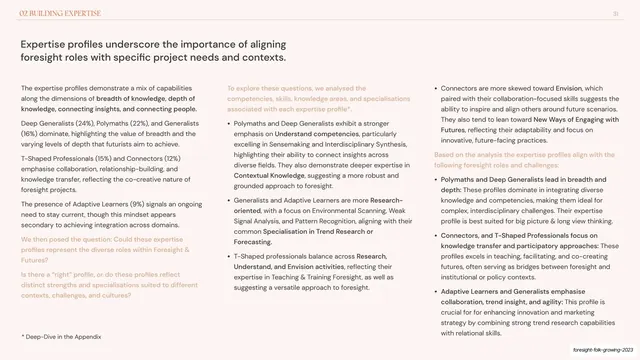
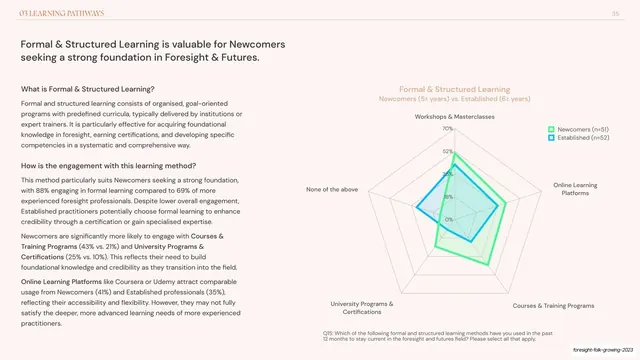
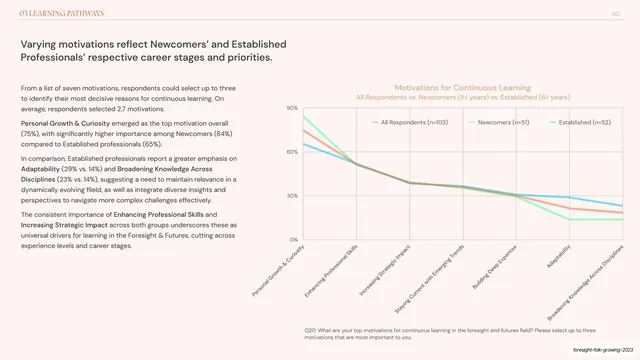
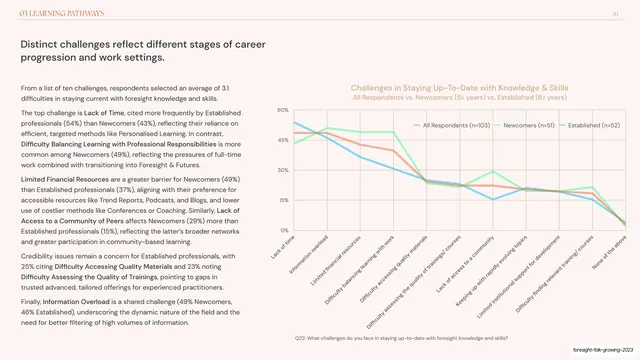
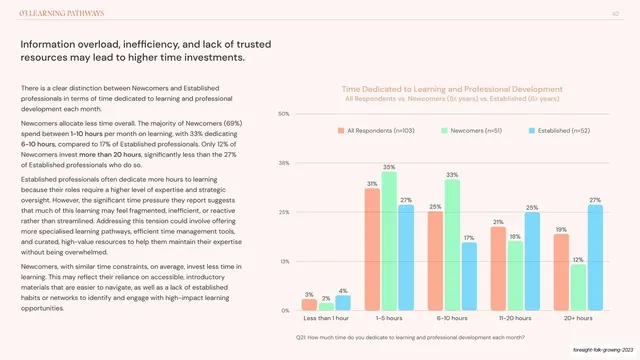
Data slide with text left and a 2x2 grid of small color-coded bar charts grouping competencies into Research, Envision, Understand and Apply.
Summary
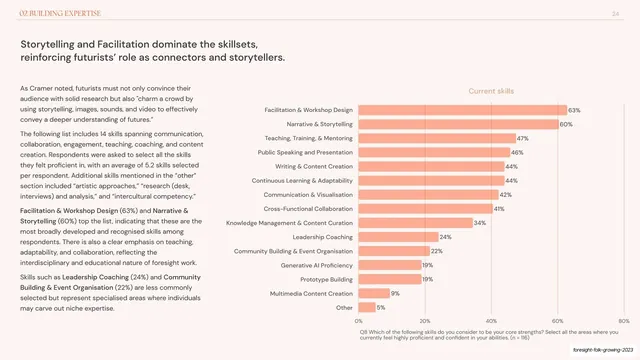
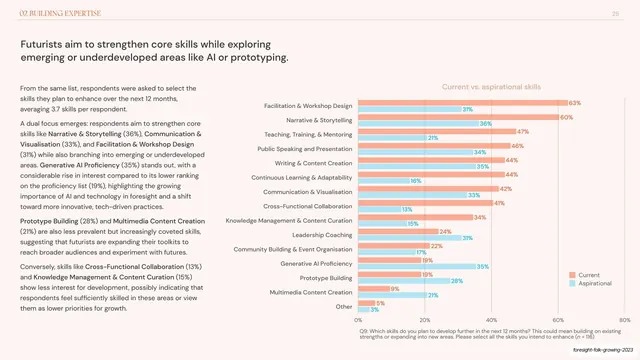
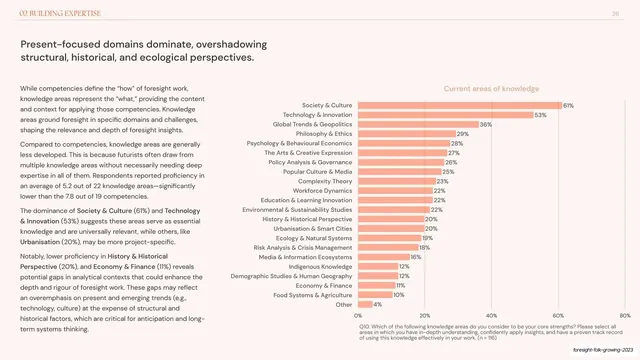
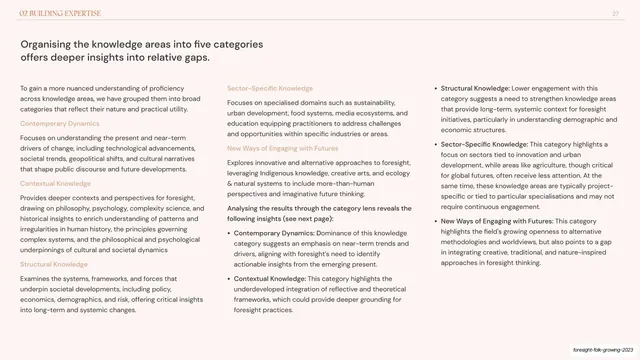
A four-panel small-multiples slide: the same competency data regrouped into Research (green), Envision (tan), Understand (blue) and Apply (orange) mini bar charts, with an analysis column on the left.
Visual description
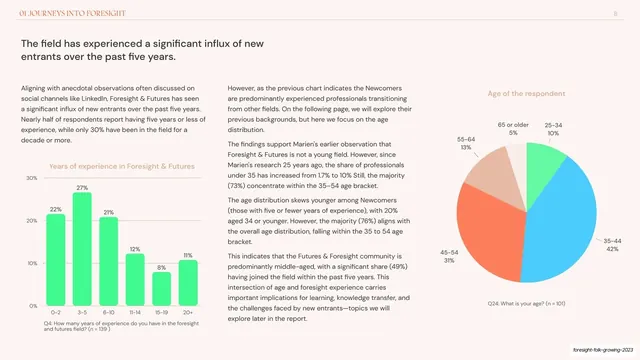
Cream background, running header on a hairline rule (chapter label left, "22" right). A two-line dark headline tops the slide. The left column holds three paragraphs of dark body copy with bold key terms. The right two-thirds is a 2x2 grid of small horizontal bar charts, each titled with a foresight activity in a distinct color: "Research" green, "Envision" tan/blush, "Understand" cyan, "Apply" orange. Each panel lists four to five competencies as labelled bars with percentages, sharing a common 0-70% x-axis. The color coding lets the four activity groups read at a glance. Grey question footnote under the charts; deck-slug annotation bottom-right.
Key takeaway
Color-coding small-multiple charts by category so a single screen compares four groups without a legend, each panel self-labelled by its colored title. Reusing one bar style and shared axis across the four panels keeps the comparison honest and the page tidy.
Reuse notes
Strong for survey decks that need to slice one dataset by category on a single slide. Cap each panel at four to five rows so the small multiples stay readable. Choose category colors with enough separation; the tan panel here is the weakest against the cream background.
From this deck: Competencies by activity four-panel bar chart
View deck

















More like this




Keep what you find
A free account saves references to boards and can send you a weekly email of picks based on what you save.
To see every result, go Pro.