
Preview image. Unlock full-res
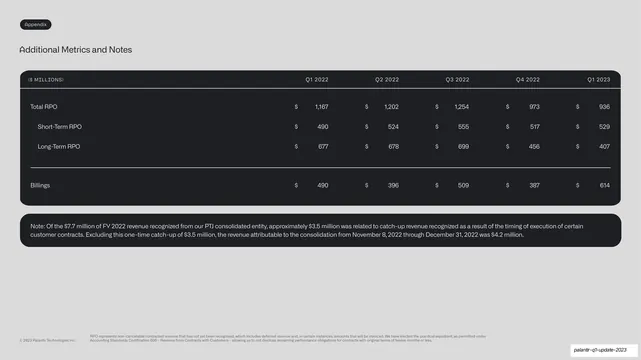
An appendix data table on a light field inside a dark rounded panel, listing total, short-term, and long-term RPO plus billings across five quarters, with a notes box below.
Summary
An appendix metrics table: total, short-term, and long-term RPO plus billings across five quarters, set in a dark rounded table panel with a notes box beneath.
Visual description
A light grey slide titled "Additional Metrics and Notes" with a small "Appendix" tab top-left. A wide rounded near-black panel holds the table: a header row in small monospace ("$ MILLIONS" and five quarter columns Q1 2022 through Q1 2023) above a thin rule, then rows for Total RPO (1,167 / 1,202 / 1,254 / 973 / 936), indented Short-Term and Long-Term RPO, a divider, and a Billings row, each cell prefixed with a "$" and right-aligned. A second rounded dark box below holds a multi-line explanatory note about PTJ consolidated revenue. Small grey RPO definitional footnotes sit at the bottom.
Key takeaway
Housing an appendix table inside the same rounded dark panel used for charts, so the data tables feel like part of the same system rather than a bare spreadsheet. Monospace column headers and right-aligned dollar cells make the figures scan cleanly.
Reuse notes
The reference pattern for any supplementary data table in a report deck. Indentation for sub-rows and a separate rounded notes box keep a dense table organized. Reuse the dark-panel-plus-monospace-header treatment across all appendix tables for consistency.
From this deck: Additional metrics RPO and billings table
View deck













More like this






Keep what you find
A free account saves references to boards and can send you a weekly email of picks based on what you save.
To see every result, go Pro.