Preview image. Unlock full-res
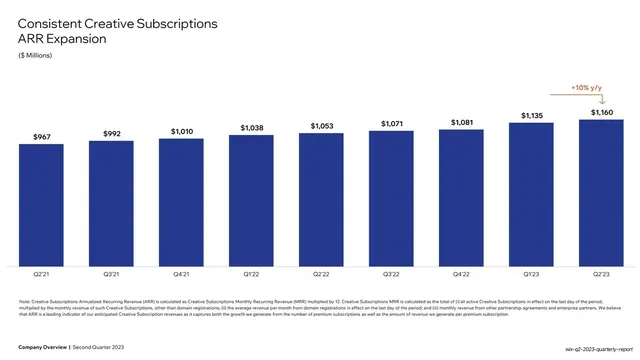
White slide charting Creative Subscriptions ARR as a steadily rising row of single navy bars with one orange y/y growth callout.
Summary
A Creative Subscriptions ARR chart: nine single navy bars climbing from $967M (Q2'21) to $1,160M (Q2'23), each value-labelled, with one orange "+10% y/y" callout over the last bars.
Visual description
White background. Two-line headline "Consistent Creative Subscriptions ARR Expansion" top-left, "($ Millions)" subtitle beneath. A single series of evenly spaced navy bars rises gently left to right across nine quarters, each capped with its dollar value. An orange "+10% y/y" label with a down-arrow marks the latest growth at top-right. A long methodology footnote runs in small grey type below the plot. Bold footer bottom-left.
Key takeaway
The restraint of a single-series bar chart that tells a "steady growth" story: uniform navy bars, every value labelled, and just one orange delta callout, with the dense ARR methodology safely tucked into a footnote so it never clutters the trend.
Reuse notes
A clean pattern for a single headline metric trending up over many periods. Pairs with the segmented stacked-bar slides in the same section while staying visually quieter. Keep the long definitional footnote small and beneath the chart, as here.
From this deck: Creative Subscriptions ARR expansion bar chart
View deck









More like this




Keep what you find
A free account saves references to boards and can send you a weekly email of picks based on what you save.
To see every result, go Pro.