Preview image. Unlock full-res
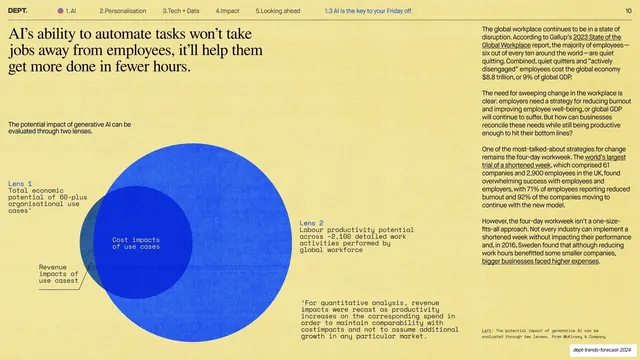
Cream body slide with a serif headline, two overlapping blue circles labelling two lenses of AI impact, and a column of body copy on the right.
Summary
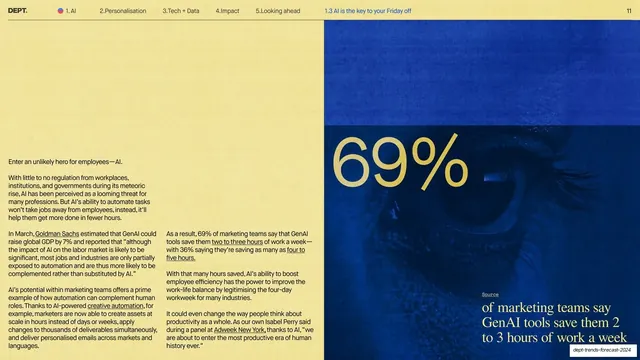
A cream data slide led by a serif headline, with two overlapping blue circles forming a Venn diagram that labels "Lens 1" and "Lens 2" of generative AI's potential impact, and a column of supporting body copy on the right.
Visual description
Warm cream ground with the section-nav bar and "10" page index up top. A three-line serif headline runs across the top-left ("AI's ability to automate tasks won't take jobs away from employees, it'll help them get more done in fewer hours."). The lower-left holds two large overlapping flat-blue circles of slightly different tone, with monospace labels: "Lens 1 Total economic potential", "Lens 2 Labour productivity potential", an inner "Cost impacts of use cases" label, and a small leader line pointing to a sliver labelled "Revenue impacts". A monospace footnote sits below. The right column carries small dark sans-serif body copy with underlined links.
Key takeaway
Reducing a two-part analytical framing to a plain two-circle Venn in flat blue, with monospace labels doing the explaining. It turns an abstract "two lenses" idea into one simple diagram without chart clutter, and the overlap visually carries the shared-impact point.
Reuse notes
Use when you need to show two overlapping scopes or perspectives without a full data chart. Flat single-color circles plus monospace labels keep it diagrammatic and on-brand. The serif headline states the conclusion; the diagram and right column supply the structure and evidence.
From this deck: Two lenses on AI impact Venn diagram
View deck






More like this




Keep what you find
A free account saves references to boards and can send you a weekly email of picks based on what you save.
To see every result, go Pro.