Preview image. Unlock full-res
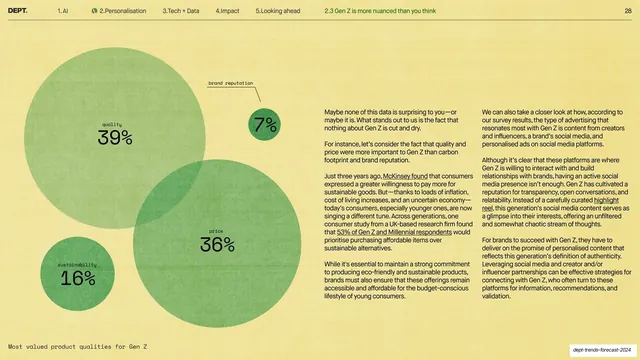
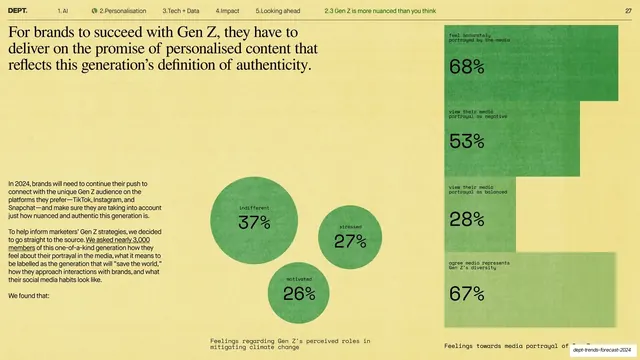
Pale-yellow data slide with a cluster of green proportional circles ranking Gen Z product values (quality, price, sustainability, brand reputation) beside two columns of body copy.
Summary
A pale-yellow survey slide ranking Gen Z's most-valued product qualities as a cluster of green proportional circles (quality 39%, price 36%, sustainability 16%, brand reputation 7%) beside two columns of body copy.
Visual description
Warm pale-yellow ground with the standard header (2.Personalisation active, sub-section "2.3 Gen Z is more nuanced than you think", page 28). The left half holds a loose cluster of flat green circles sized to their values: a large "quality 39%" and "price 36%" dominate, with smaller "sustainability 16%" and a small "brand reputation 7%" on a thin leader line, each labeled in monospace with a big percentage. A caption "Most valued product qualities for Gen Z" sits bottom-left. The right half is two columns of small dark sans-serif body copy with several underlined inline links.
Key takeaway
The proportional-circle ranking: bubble size does the comparison instantly, so the numbers need almost no chrome. Using the same flat green and monospace labels as the deck's other data slides makes it part of a consistent survey-data language.
Reuse notes
Best for a single-question ranking where the magnitudes matter more than precision. Four or five bubbles is the sweet spot. Pair with body copy at right (the deck's recurring split). Keep the bubble style identical to other data slides so the report reads as one system.
From this deck: Gen Z product values (proportional circles + body)
View deck


















































More like this





Keep what you find
A free account saves references to boards and can send you a weekly email of picks based on what you save.
To see every result, go Pro.