Preview image. Unlock full-res
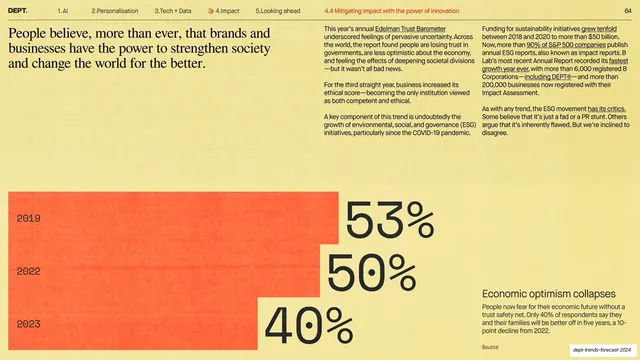
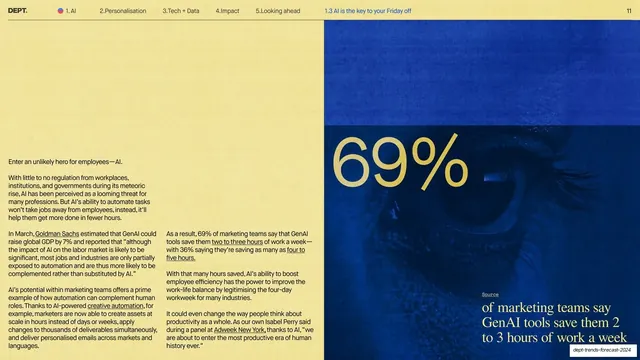
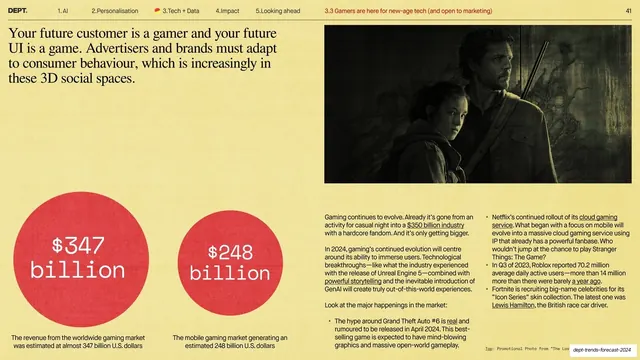
A serif statement and three columns of body copy sit above an oversized stepped orange bar chart reading 53/50/40% for 2019, 2022 and 2023.
Summary
A statement-plus-data slide: a two-line serif headline and three columns of body copy occupy the top, while the bottom half is a descending stepped orange bar block labeled 53%, 50% and 40% for 2019, 2022 and 2023.
Visual description
Warm yellow background with the running header on a hairline rule and the active sub-section in red. The top-left holds a two-line black serif statement about brands having the power to strengthen society; to its right, three columns of small sans-serif body copy with underlined links discuss the Edelman Trust Barometer and ESG growth. The lower half is a large orange shape stepping down from left to right like a descending bar chart, with year labels "2019, 2022, 2023" reversed out at the left edge and oversized black percentages "53%, 50%, 40%" stepping down the middle. A short captioned note "Economic optimism collapses" with body copy and a "Source" link sits at the lower right.
Key takeaway
Turning a three-point time series into one oversized stepped block instead of a conventional chart, with the numbers themselves doing the work. The descending steps read the decline instantly. Serif statement on top, data on the bottom keeps a clear two-zone slide.
Reuse notes
A strong reference for a "trend over a few years" slide where exact axes do not matter. Works for any short descending or ascending series; keep it to three or four steps before it gets noisy. Reuse the oversized-number-as-chart approach to stay on the deck's editorial register.
From this deck: Brands strengthen society statement with stepped bar stat
View deck












More like this



Keep what you find
A free account saves references to boards and can send you a weekly email of picks based on what you save.
To see every result, go Pro.