Preview image. Unlock full-res
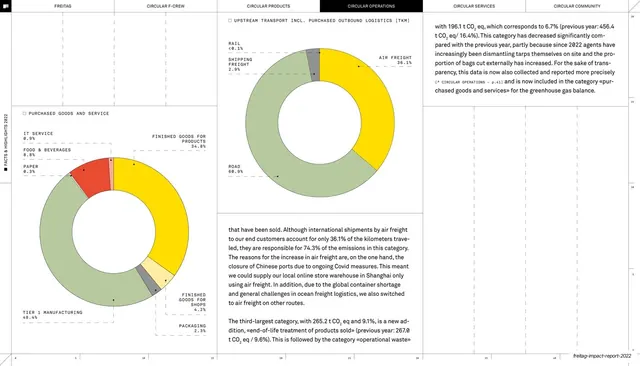
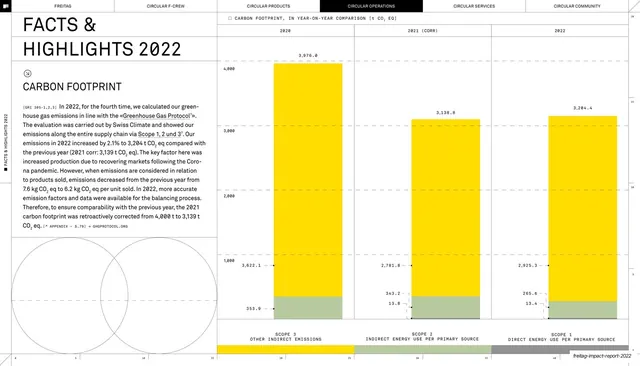
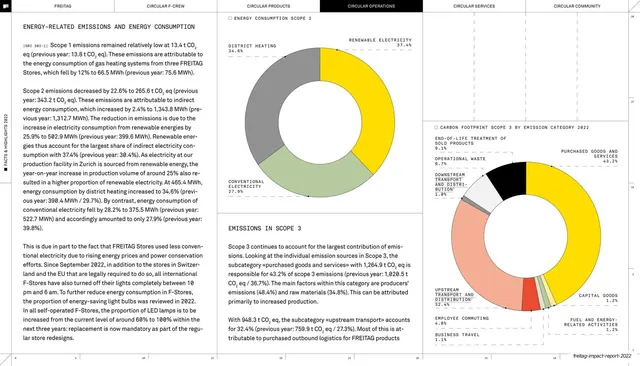
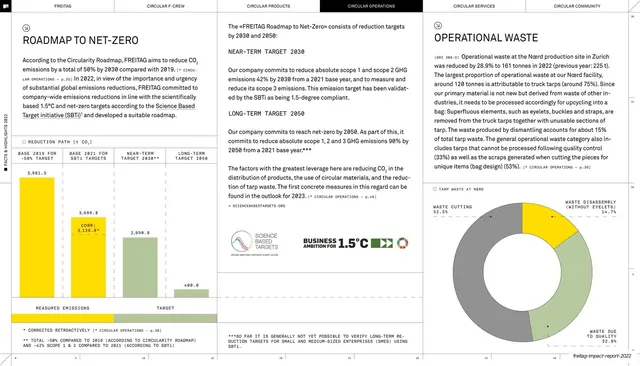
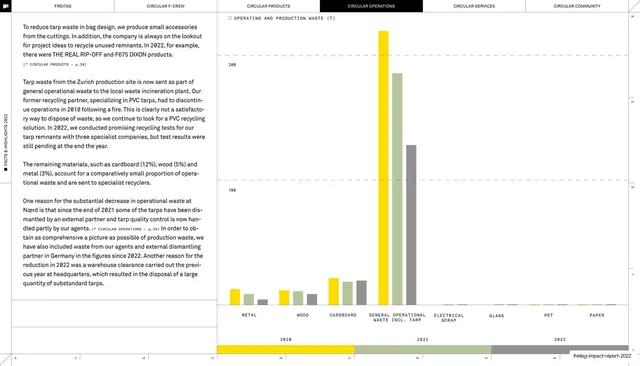
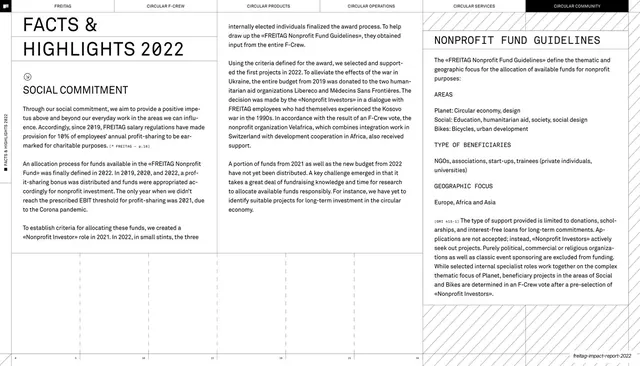
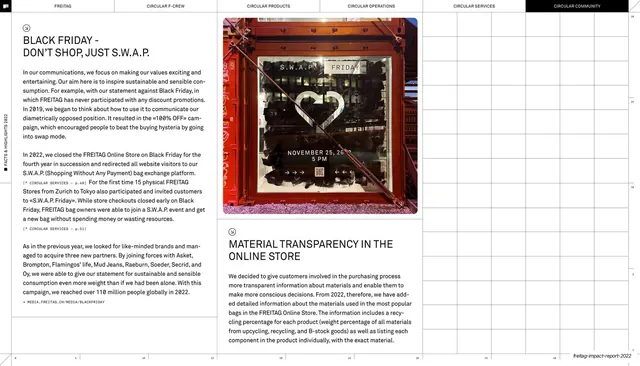
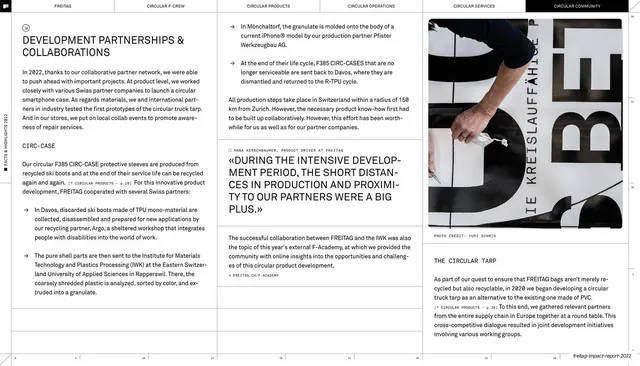
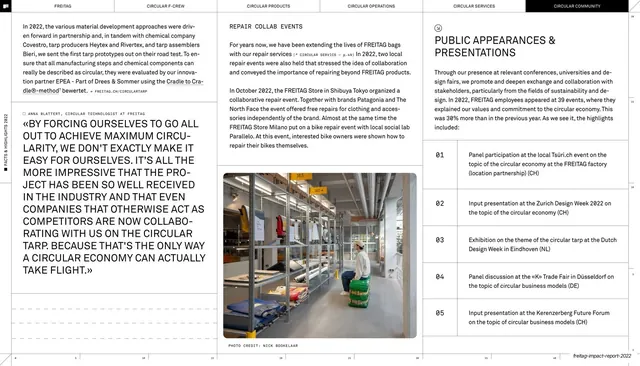
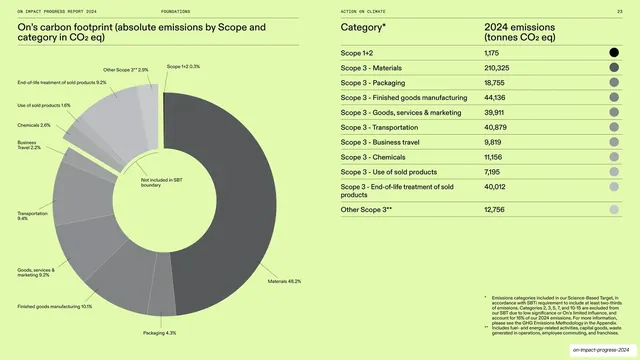
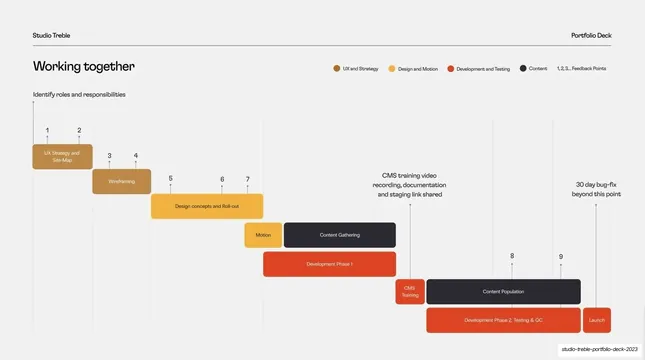
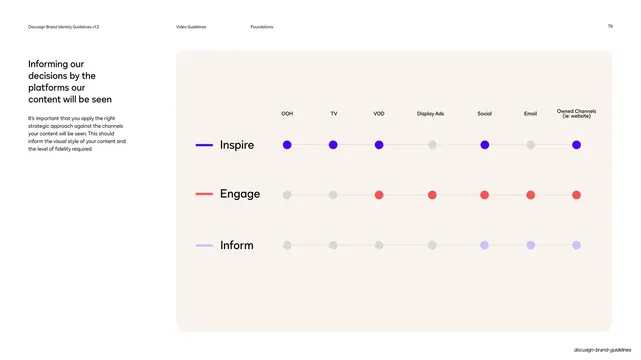
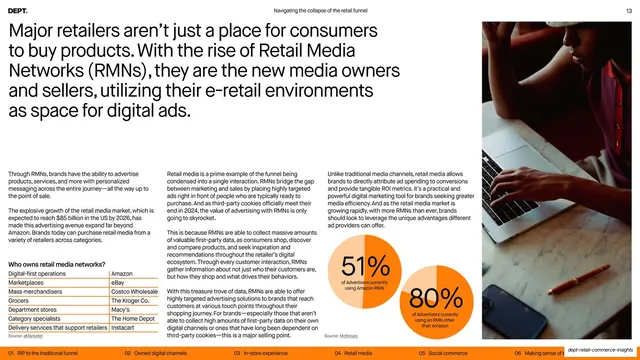
Three-column emissions spread with two donut charts breaking down purchased goods and upstream transport, surrounded by justified explanatory text.
Summary
A continuation emissions spread with two donut charts (a "PURCHASED GOODS AND SERVICE" ring lower-left and an "UPSTREAM TRANSPORT" ring upper-centre) set among three columns of small justified explanatory text.
Visual description
The six-tab header sits across the top, CIRCULAR OPERATIONS inverted. The page is mostly white with three text columns of small justified paragraphs and monospace cross-references. Two donut charts dominate: a lower-left ring titled "PURCHASED GOODS AND SERVICE" with a large green tier-1-manufacturing wedge, a yellow finished-goods wedge and a single salient orange-red slice, and an upper-centre ring titled "UPSTREAM TRANSPORT INCL. PURCHASED OUTBOUND LOGISTICS" split green (road), yellow (air freight) and thin grey slices. Every slice carries a label and percentage on thin leader lines. Hairline column rules and a faint numeric ruler frame the layout; the deck-slug footer is bottom-right.
Key takeaway
Introducing a single warm orange-red slice into an otherwise yellow-green-grey palette to flag one notable category, so the eye lands on it without a callout. Donuts float inside the text columns rather than in a separate panel, keeping figures next to their explanation.
Reuse notes
Use for the deeper data pages of a report where several breakdowns stack up. The one-accent-slice trick reads instantly but loses its power if overused across many charts. Requires tight typographic control to keep three text columns and two charts from crowding.
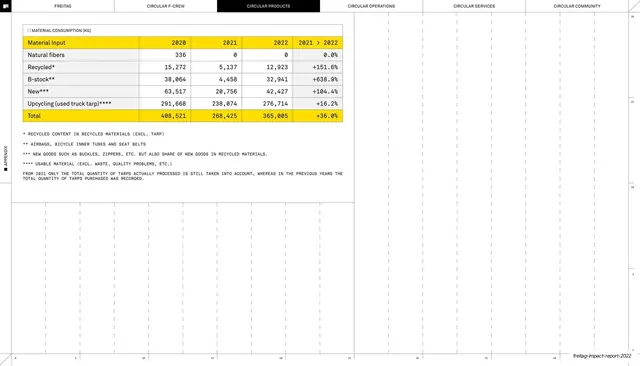
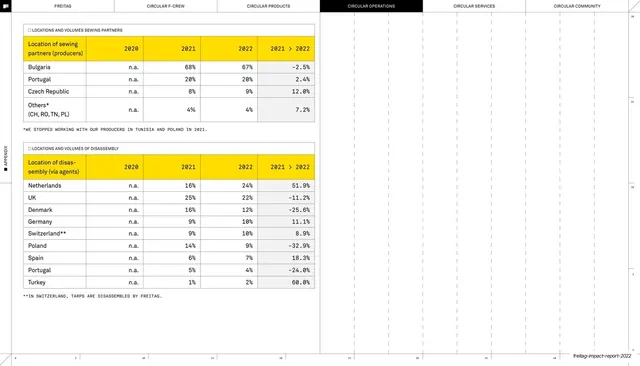
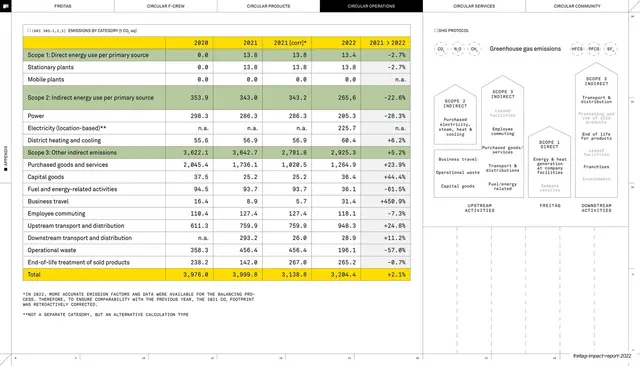
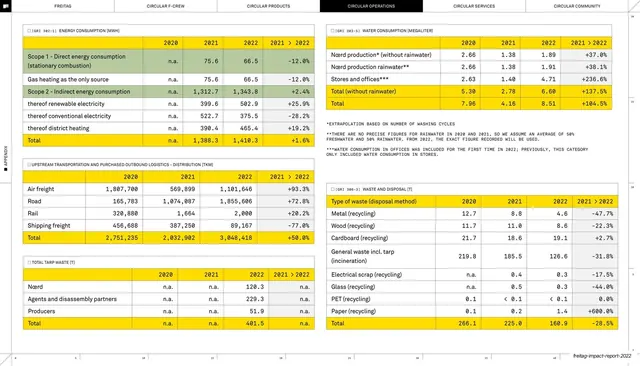
From this deck: Transport and purchased goods donuts
View deck



More like this



Keep what you find
A free account saves references to boards and can send you a weekly email of picks based on what you save.
To see every result, go Pro.