Preview image. Unlock full-res
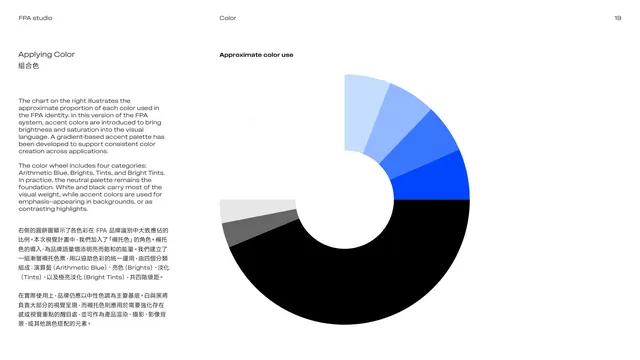
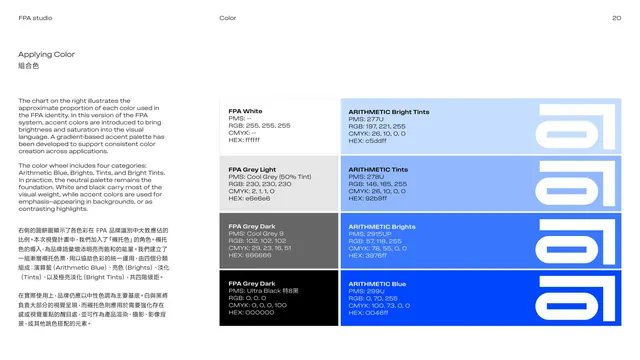
Color-application page with a donut chart showing approximate color proportions, dominated by black and white with blue accent wedges.
Summary
The color-proportion page: a donut chart on the right shows how much of each color the identity uses, with black and white taking most of the ring and a graded set of blue wedges (Arithmetic Blue, Brights, Tints, Bright Tints) as accents.
Visual description
White page. The left column explains in English over Chinese that accent colors add brightness and saturation, that a gradient-based accent palette supports consistent use, and that the wheel has four categories (Arithmetic Blue, Brights, Tints, Bright Tints) while neutrals carry most of the weight. The right side is a large donut chart titled "Approximate color use": the bottom half is solid black, a thin slice is grey, and the upper-right arc steps through four blues from deep Arithmetic Blue to a pale tint. White fills the remaining arc.
Key takeaway
A proportion donut is a fast way to communicate how dominant neutrals should stay versus how sparingly accents appear. Stepping the accent into four graded blues defines a whole accent family in one diagram.
Reuse notes
Use a proportion chart to set expectations about color balance, not just to list swatches. Effective when the brand is mostly neutral with a controlled accent. Pair with the exact specs page that follows.
From this deck: Applying color, proportion donut
View deck















More like this



Keep what you find
A free account saves references to boards and can send you a weekly email of picks based on what you save.
To see every result, go Pro.