Preview image. Unlock full-res
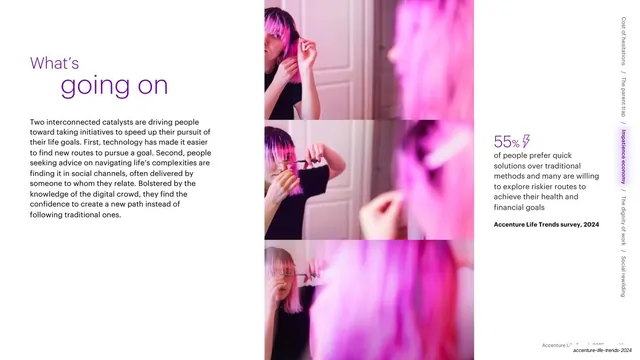
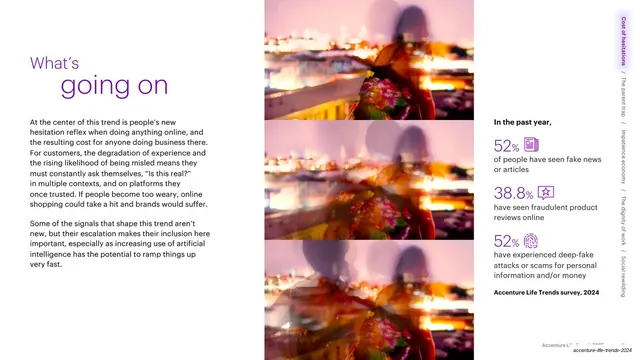
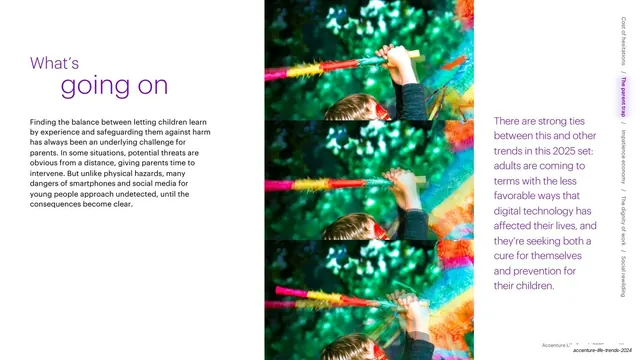
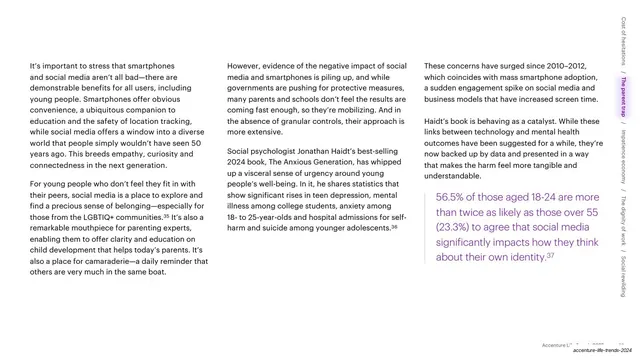
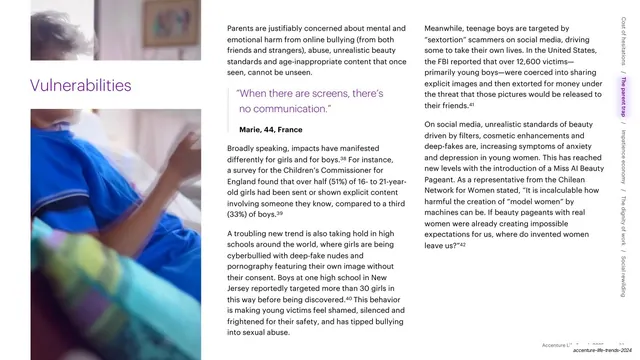
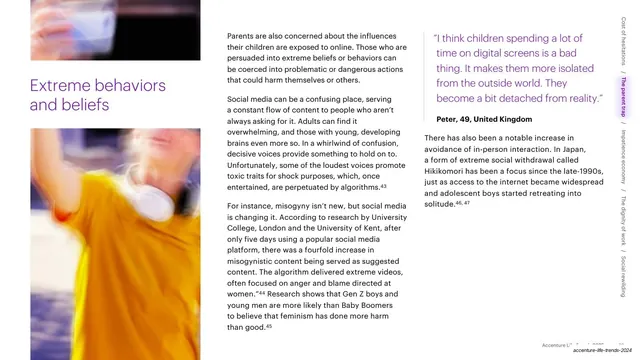
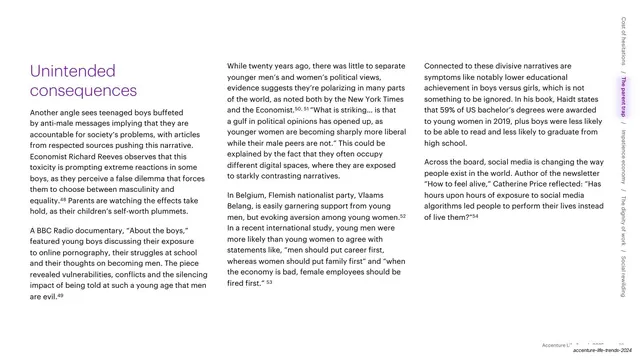
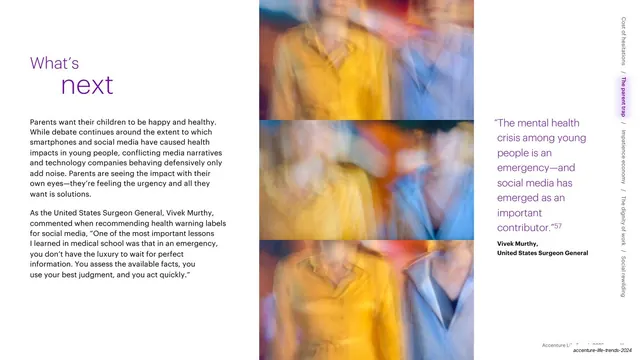
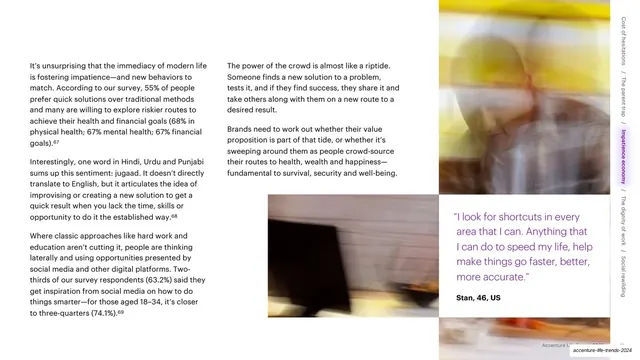
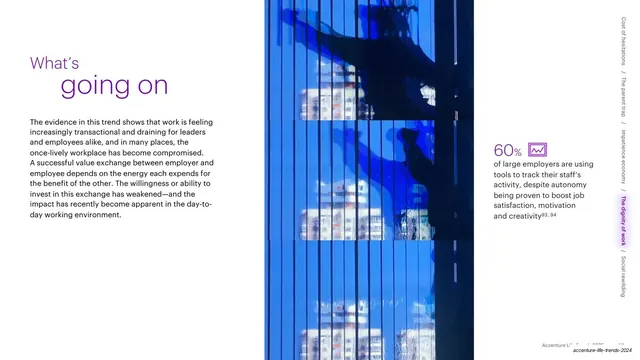
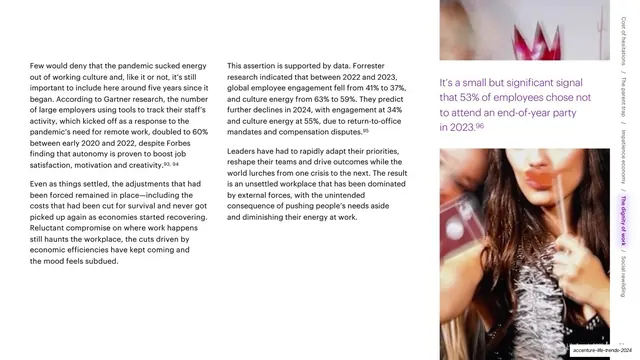
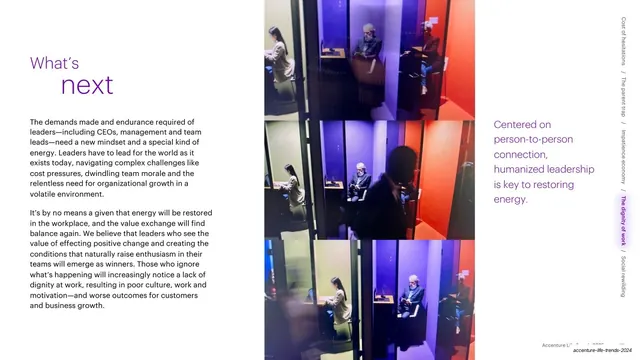
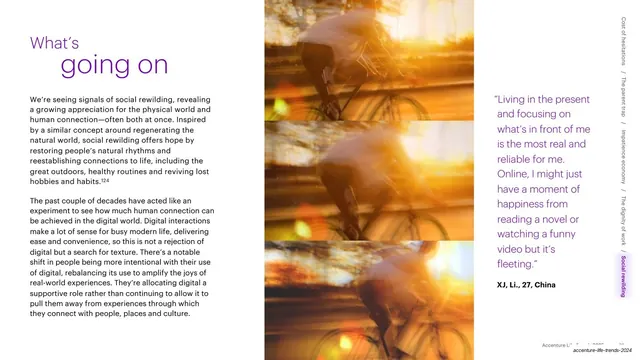
Three-column slide with a two-weight purple "What's going on" headline, a center stack of three blurred photos, and a large 55% stat with a trend rail on the right.
Summary
A three-part "What's going on" slide: explanatory copy on the left, a vertical stack of three blurred photos in the center, and an oversized 55% statistic on the right, with the deck's trend rail running up the far edge.
Visual description
On the left, the recurring two-weight headline, "What's" in thin purple above "going on" in heavy purple, sits over a single paragraph of dark body text. The center column stacks three small motion-blurred pink photographs of a person cutting their hair. On the right, a large purple "55%" with a small lightning-bolt icon tops a short supporting sentence and a bold "Accenture Life Trends survey, 2024" attribution. The far right edge carries a vertical rail of rotated trend names, with "Impatience economy" highlighted in purple.
Key takeaway
The three-zone rhythm: argument, evidence images, and a headline statistic, read left to right. The big colored percentage with a tiny icon is a punchy way to anchor one number, and the vertical trend rail doubles as a persistent table of contents.
Reuse notes
Excellent for data-backed report slides that need to pair narrative, imagery, and a single hero metric in one view. The vertical rail is reusable as a chapter wayfinder across a long deck. Reserve the stacked-photo column for cases where you have a coherent image sequence.
From this deck: What's going on with stacked photos and stat
View deck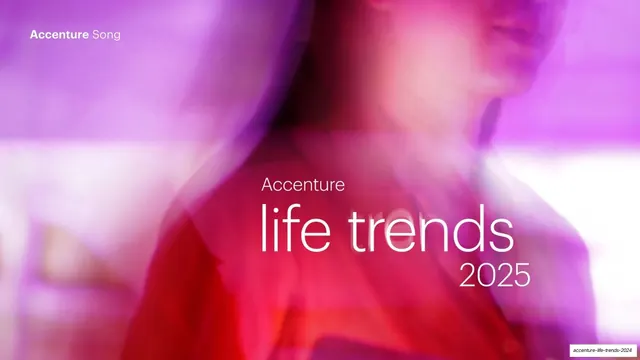

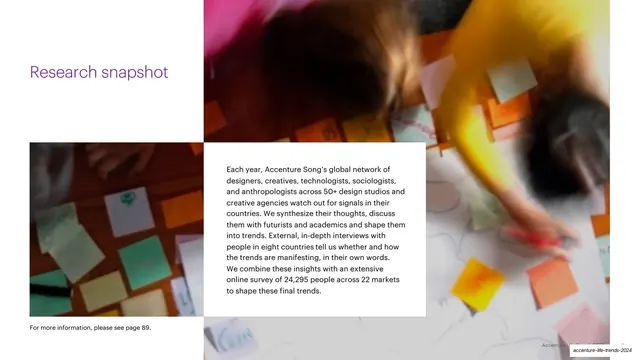
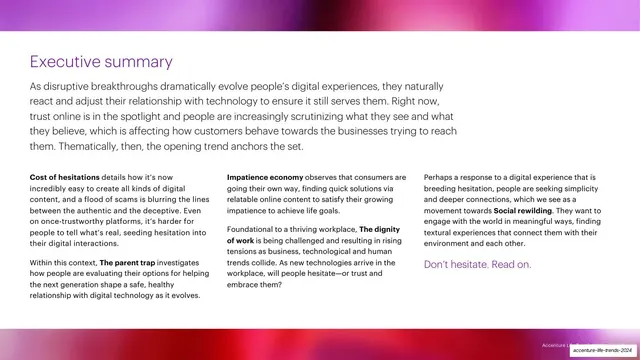


More like this

Keep what you find
A free account saves references to boards and can send you a weekly email of picks based on what you save.
To see every result, go Pro.