Preview image. Unlock full-res
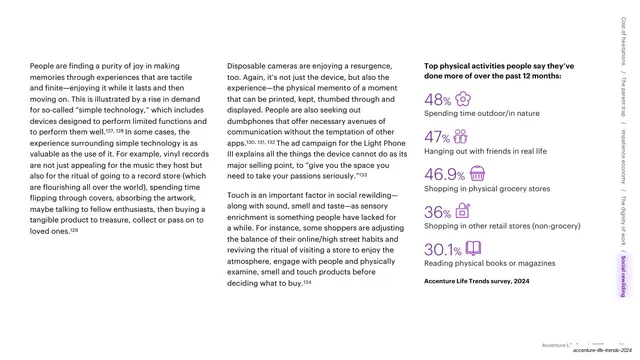
White three-column slide pairing two columns of body text with a right-hand list of five large purple percentage stats, each with a tiny line icon, on the top physical activities.
Summary
A data slide where two text columns sit beside a right-hand stat list of five oversized purple percentages, each labelled and topped with a small outline icon.
Visual description
White background, three-column grid. The two left columns are continuous small black body text. The right column is headed in bold black "Top physical activities people say they've done more of over the past 12 months:" then lists five statistics top to bottom: 48% (spending time outdoor/in nature), 47% (hanging out with friends in real life), 46.9% (shopping in physical grocery stores), 36% (shopping in other retail stores), 30.1% (reading physical books or magazines). Each figure is set very large in purple with a small purple line icon to its right, and a black caption beneath. A bold "Accenture Life Trends survey, 2024" source line closes the column. The rotated trend tab runs down the right edge with "Social rewilding" in purple. Page number and slug bottom-right.
Key takeaway
The vertical stack of oversized accent-color percentages, each paired with a tiny matching icon and a one-line label, makes a scannable mini-dashboard out of a single column. It reads instantly even next to dense prose.
Reuse notes
Ideal for survey result rollups and any slide that needs a "by the numbers" sidebar alongside narrative. The big-number-plus-icon-plus-label unit is a portable component. Keep the icon weight light so the number stays dominant.
From this deck: Simple technology and physical activities stat slide
View deck










































More like this






Keep what you find
A free account saves references to boards and can send you a weekly email of picks based on what you save.
To see every result, go Pro.