Preview image. Unlock full-res
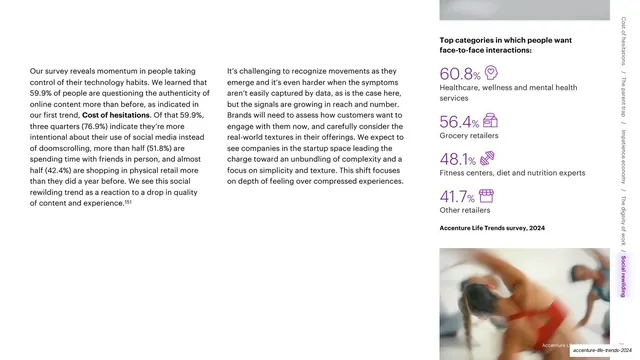
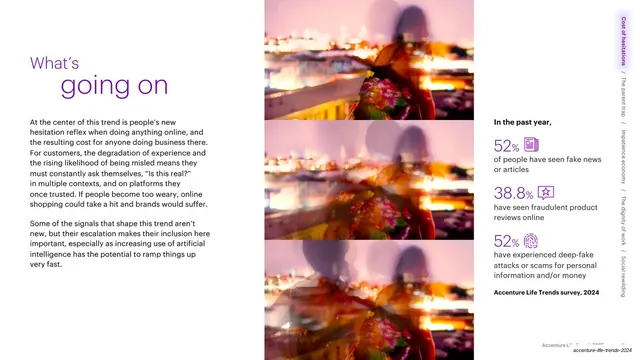
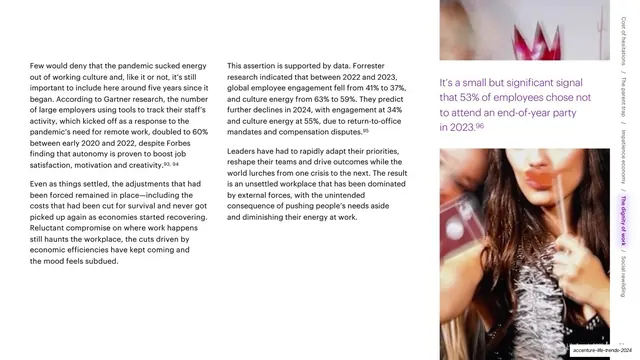
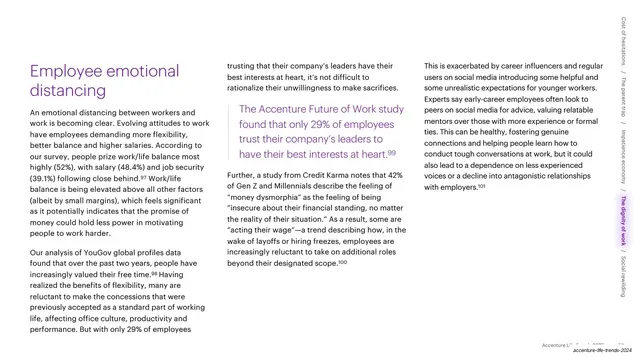
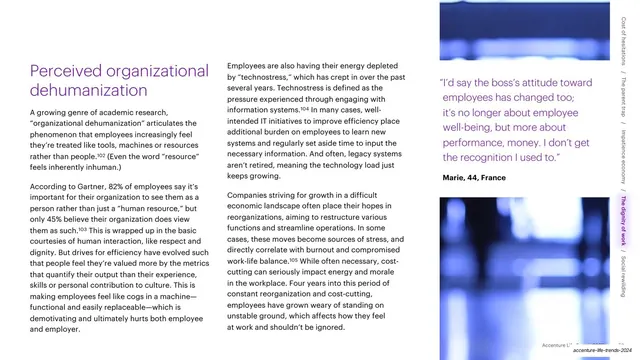
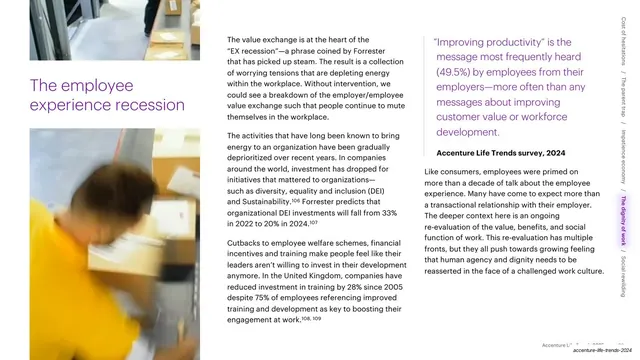
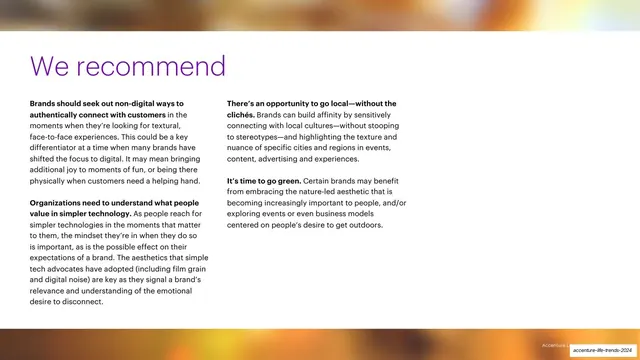
White slide with two columns of body text at left and a right column stacking four large purple percentage stats between two soft photos, on face-to-face interaction categories.
Summary
A data slide pairing two text columns with a right-hand stat list of four oversized purple percentages, top-and-tailed by two soft photographs.
Visual description
White background, three-column grid. The two left columns are continuous small black body text, with one inline bold lead-in ("Cost of hesitations"). The right column is bookended by photos: a small soft image at the top and a blurred shot of people at the bottom. Between them sits a bold black header "Top categories in which people want face-to-face interactions:" and four statistics stacked vertically: 60.8% (healthcare, wellness and mental health services), 56.4% (grocery retailers), 48.1% (fitness centers, diet and nutrition experts), 41.7% (other retailers). Each figure is large purple with a small purple line icon, plus a black caption, and a bold "Accenture Life Trends survey, 2024" source line. The rotated trend tab runs down the far-right edge, "Social rewilding" in purple. Slug bottom-right.
Key takeaway
Sandwiching a numbered stat list between two photographs in the same column, so a data sidebar still feels grounded in imagery rather than floating as a bare chart. The big-number-plus-icon unit stays consistent with the deck's other stat slides.
Reuse notes
Reuse for ranked survey results where you want some warmth around the numbers. The photo bookends are optional but make a long stat list feel less like a spreadsheet. Keep all percentages in the same accent color and size so the ranking reads at a glance.
From this deck: Cost of hesitations stat-and-photo slide
View deck







More like this






Keep what you find
A free account saves references to boards and can send you a weekly email of picks based on what you save.
To see every result, go Pro.