
Preview image. Unlock full-res
Appendix bubble map sizing respondents prior fields of expertise as color-coded circles scattered across a cream ground.
Summary
An appendix data slide titled "Overview: Previous Experience": a bubble map where each prior field of expertise is a circle sized by how many respondents named it, color-coded into five super-categories.
Visual description
Pale warm-cream background with the "APPENDIX" header and page number "57" on a hairline rule. A dark-grey slide title sits upper-left ("Overview: Previous Experience"). The body is a free-floating field of labeled circles scaled by entry count: large circles on the left (Marketing & Brand, Market Research & Analysis, Operations & Project Management, Business & Management) shrink to tiny dots on the right (Military, Sociology, Nursing). Fill color encodes one of five groups, keyed in a lower-left legend with color swatches: blue (Business, Management & Leadership), orange-red (Global Issues, Diplomacy & Public Administration), tan (Innovation, Technology & Applied Sciences), green (Knowledge & Information Exchange), dark grey (Academia & Other Fields). Smaller bubbles use leader lines to their labels. Footnotes read "Circle size represents number of entries" and "Based on 117 respondents; 396 entries; Ø 3.4 expertise fields per respondent."
Key takeaway
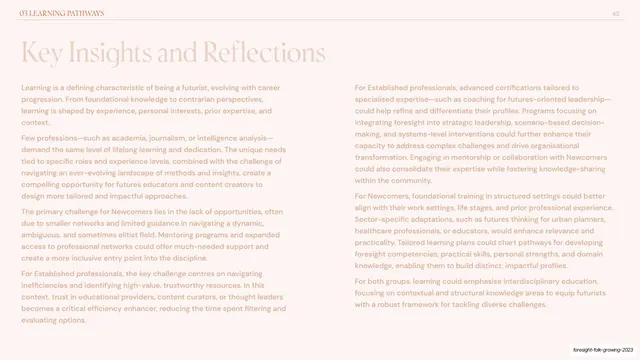
Encoding two variables at once, magnitude through circle area and category through fill color, so a long tail of fields collapses into one readable picture instead of a 20-row table. Letting the big bubbles cluster left and the long tail trail off right gives the scatter an intuitive reading order.
Reuse notes
Great for showing "where people came from" or any frequency distribution with a heavy head and a long tail. Bubble area is hard to read precisely, so use it for relative scale, not exact values, and always pair with a count footnote. Needs careful manual placement to avoid overlap; not a chart that auto-lays-out cleanly.
From this deck: Previous experience bubble map
View deck





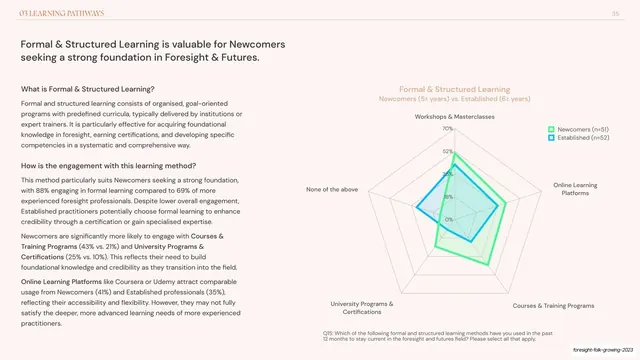
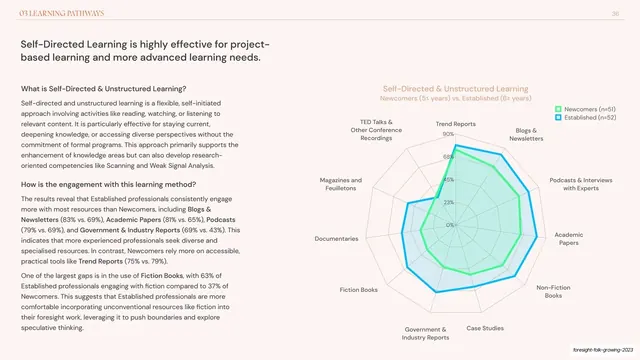
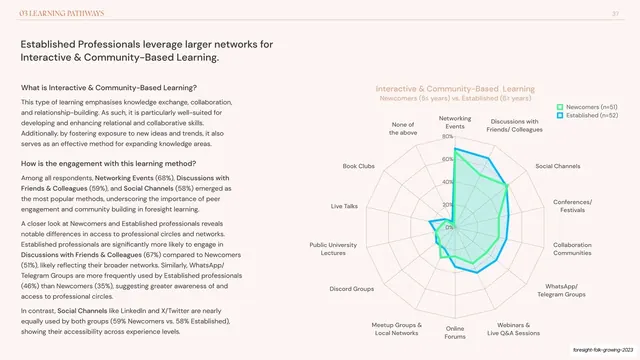
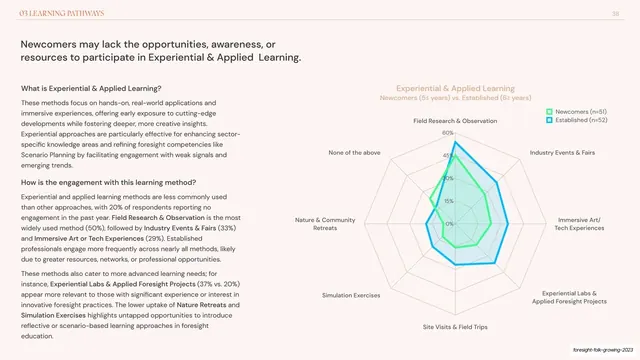





More like this



Keep what you find
A free account saves references to boards and can send you a weekly email of picks based on what you save.
To see every result, go Pro.