Preview image. Unlock full-res
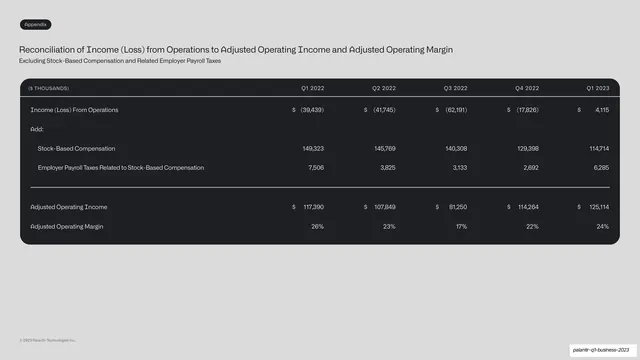
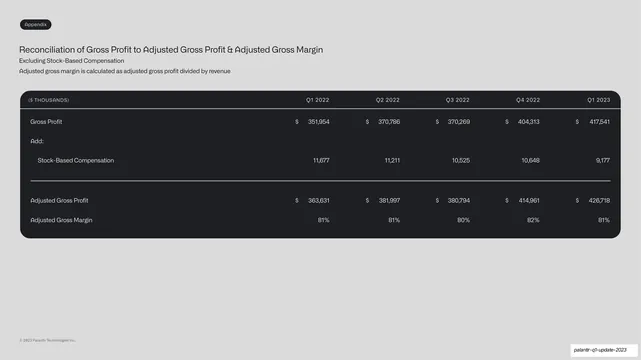
An appendix reconciliation table inside a dark rounded panel, bridging income from operations to adjusted operating income and margin across five quarters.
Summary
A non-GAAP reconciliation: income (loss) from operations bridged to adjusted operating income and margin across five quarters, in the standard dark table panel.
Visual description
A light grey slide with an "Appendix" tab and the title "Reconciliation of Income (Loss) from Operations to Adjusted Operating Income and Adjusted Operating Margin", with a subhead noting the excluded items. A wide rounded near-black panel holds the table: monospace header ("$ THOUSANDS" and five quarter columns), then Income (Loss) From Operations (with negatives in parentheses, (39,439) ... 4,115), an "Add:" line with indented Stock-Based Compensation and Employer Payroll Taxes rows, a divider, then Adjusted Operating Income (117,390 ... 125,114) and Adjusted Operating Margin (26% / 23% / 17% / 22% / 24%). Right-aligned dollar cells.
Key takeaway
The reconciliation handling a metric that starts negative and turns positive, with parenthesized losses bridged by multiple add-back rows to a positive adjusted result. The repeated panel makes a third dense table feel routine rather than daunting.
Reuse notes
Reuse for any operating-income or EBITDA-style reconciliation with multiple adjustment lines. Parentheses plus add-back rows clearly show how a GAAP loss becomes a non-GAAP profit. Keep the margin row aligned with the corresponding in-deck chart.
From this deck: Adjusted operating income reconciliation table
View deck














More like this




Keep what you find
A free account saves references to boards and can send you a weekly email of picks based on what you save.
To see every result, go Pro.