Preview image. Unlock full-res
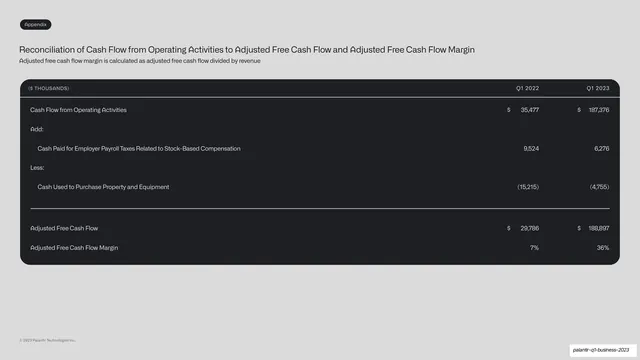
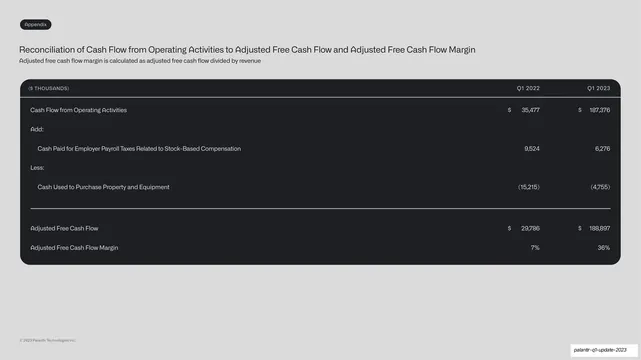
An appendix reconciliation table inside a dark rounded panel, bridging cash flow from operating activities to adjusted free cash flow and margin for two quarters.
Summary
A non-GAAP reconciliation: cash flow from operating activities bridged to adjusted free cash flow and its margin, set in the standard dark table panel for two quarters.
Visual description
A light grey slide with an "Appendix" tab top-left and the title "Reconciliation of Cash Flow from Operating Activities to Adjusted Free Cash Flow and Adjusted Free Cash Flow Margin", plus a one-line subhead defining the margin. A wide rounded near-black panel holds the table: a monospace header ("$ THOUSANDS", Q1 2022, Q1 2023), then Cash Flow from Operating Activities (35,477 / 187,376), an "Add:" line and indented payroll-taxes row, a "Less:" line and indented property-and-equipment row (in parentheses), a divider rule, then Adjusted Free Cash Flow (29,786 / 188,897) and Adjusted Free Cash Flow Margin (7% / 36%). Dollar signs and right alignment throughout.
Key takeaway
The add/less reconciliation laid out with indented adjustment rows, a divider, and a bold result line, all inside the same rounded dark panel, so a required non-GAAP bridge stays on-brand and easy to follow. Parentheses for subtractions keep the math transparent.
Reuse notes
The template for any GAAP-to-non-GAAP or before/after reconciliation in an investor appendix. The add/less/result structure with indentation is standard finance practice rendered cleanly. Two-column quarter comparison keeps it compact; widen to more periods using the same grammar.
From this deck: Adjusted free cash flow reconciliation table
View deck













More like this


Keep what you find
A free account saves references to boards and can send you a weekly email of picks based on what you save.
To see every result, go Pro.