Preview image. Unlock full-res
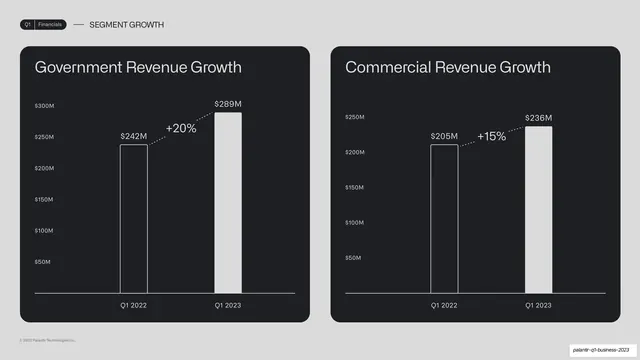
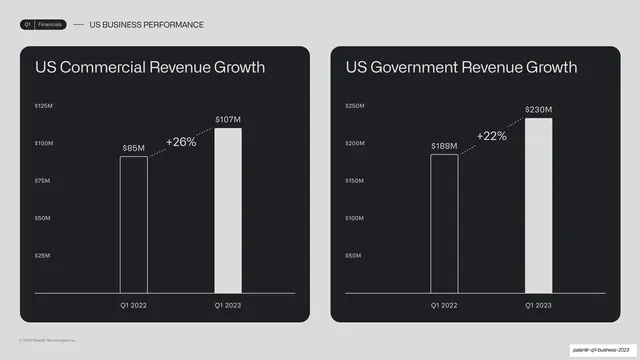
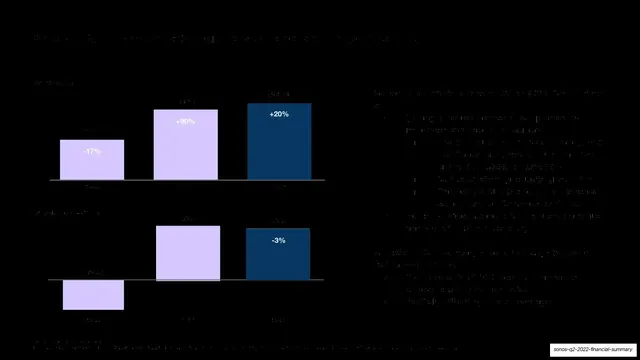
Two side-by-side dark chart cards comparing total Government and Commercial revenue growth, each a two-bar year-over-year chart with a dotted percent callout.
Summary
Segment growth two-up: side-by-side dark chart cards for total Government Revenue Growth and Commercial Revenue Growth, each a two-bar year-over-year chart with a dotted percent callout.
Visual description
A light grey slide repeating the two-up layout. Running header reads "Q1 | Financials" and "SEGMENT GROWTH". Left card, "Government Revenue Growth", plots Q1 2022 ($242M, outlined) to Q1 2023 ($289M, solid) with a dotted "+20%" callout. Right card, "Commercial Revenue Growth", plots Q1 2022 ($205M) to Q1 2023 ($236M) with a dotted "+15%" callout. White bars, monospace axis labels, matching scale treatment.
Key takeaway
The repeated two-card comparison applied to the next pair of segments, reinforcing the deck's chart grammar. Consistent bar styling and callout placement let viewers compare across slides, not just within them.
Reuse notes
Reuse this two-up for any pair of segment or category metrics. The value of repeating the exact card layout across consecutive slides is cumulative legibility; resist restyling each chart. Split to single cards if one chart needs more axis detail.
From this deck: Government vs commercial segment growth two-up
View deck














More like this





Keep what you find
A free account saves references to boards and can send you a weekly email of picks based on what you save.
To see every result, go Pro.