Preview image. Unlock full-res
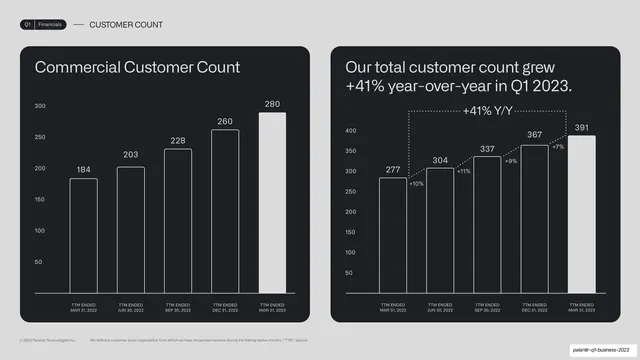
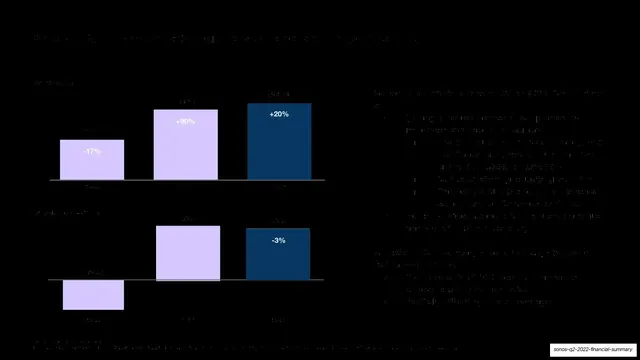
Two side-by-side dark chart cards on customer counts, a five-bar commercial-customer chart and a five-bar total-customer chart with stepped percent labels and a +41% Y/Y bracket.
Summary
A customer-growth two-up: a five-bar Commercial Customer Count chart beside a five-bar total-customer chart annotated with stepped quarter-over-quarter percentages and a +41% year-over-year bracket.
Visual description
A light grey slide in the two-up layout. Running header reads "Q1 | Financials" and "CUSTOMER COUNT". Left card, "Commercial Customer Count", shows five ascending bars across TTM periods (184, 203, 228, 260, 280), the final bar solid white and the rest outlined, each topped with its value. Right card, "Our total customer count grew +41% year-over-year in Q1 2023", shows five ascending bars (277, 304, 337, 367, 391) with small stepped "+10%, +11%, +9%, +7%" labels between bar tops and a dotted "+41% Y/Y" bracket spanning the full range. A small grey footnote defines a customer. Monospace axis labels throughout.
Key takeaway
The five-bar trend with small per-step percentages plus an overarching dotted bracket for the cumulative change, showing both the quarter-by-quarter pace and the headline year-over-year figure in one chart. The final bar going solid marks the current period.
Reuse notes
Strong for any count or volume metric tracked over five periods. The stepped-percent-plus-bracket technique communicates compounding growth clearly; use it when both incremental and total change matter. Keep the current period highlighted as the solid bar across all such charts.
From this deck: Commercial and total customer count two-up
View deck















More like this





Keep what you find
A free account saves references to boards and can send you a weekly email of picks based on what you save.
To see every result, go Pro.