Preview image. Unlock full-res
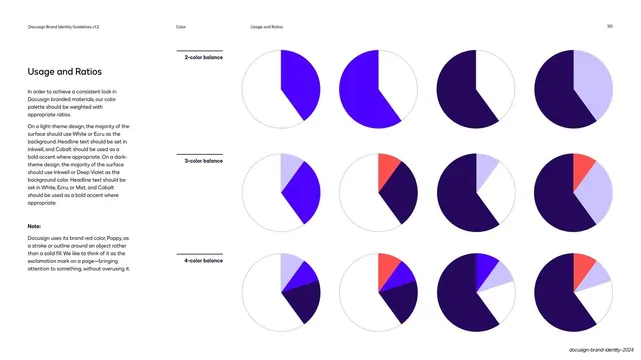
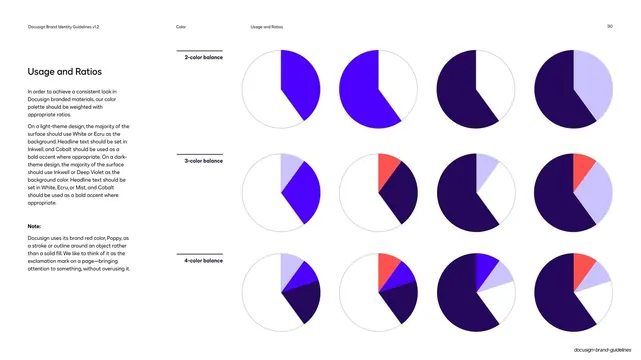
Color weighting page using a grid of pie charts to show recommended 2-, 3-, and 4-color balance ratios across the palette.
Summary
The color-ratio page: rows of pie charts demonstrating recommended 2-color, 3-color, and 4-color balances so layouts keep a consistent weighting of the palette.
Visual description
Standard page chrome ("Color" / "Usage and Ratios", page "30"). The left column heading "Usage and Ratios" runs over paragraphs on weighting (white/ecru dominant on light themes, inkwell/deep violet dominant on dark) plus a "Note:" that Poppy is used only as a stroke. The right two-thirds is a 3-row grid of pie charts, each row labeled "2-color balance", "3-color balance", and "4-color balance". Each row has four pies showing the same palette split into progressively more slices, mixing white, cobalt, inkwell, deep violet, and a thin poppy wedge, so each row reads as a set of acceptable proportions.
Key takeaway
Expressing abstract color weighting as literal pie proportions, organized by how many colors are in play, turns "use this dominantly" into something measurable. A note carving Poppy out as a stroke-only accent prevents overuse of the loudest color.
Reuse notes
A reusable way to encode color proportions in any palette guideline, especially when a brand wants restraint. Pies read fast; keep the accent color as a thin wedge to mirror its sparing real-world use.
From this deck: DocuSign color usage and ratios
View deck





































More like this




Keep what you find
A free account saves references to boards and can send you a weekly email of picks based on what you save.
To see every result, go Pro.