Preview image. Unlock full-res
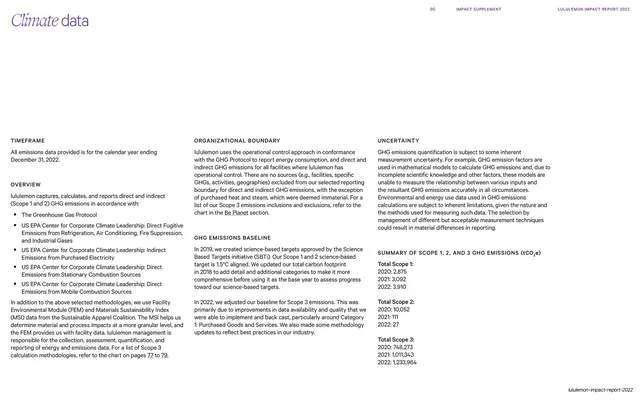
A four-column climate-data methodology page mixing running-text notes on timeframe, boundary, and uncertainty with a short GHG emissions summary by scope.
Summary
A methodology-heavy climate-data page laid out as four text columns under small all-caps subheads, closing with a compact scope-by-scope emissions summary.
Visual description
White 16:9 page. A serif italic "Climate" pairs with an upright sans "data" as the headline, top left, in muted violet. Below, four narrow columns of small dark-grey body copy sit under tiny all-caps section labels: "TIMEFRAME", "OVERVIEW", "ORGANIZATIONAL BOUNDARY", "GHG EMISSIONS BASELINE", "UNCERTAINTY", and "SUMMARY OF SCOPE 1, 2, AND 3 GHG EMISSIONS (tCO2e)". The overview column carries an indented bulleted list of EPA emission-source categories. The final column gives three small stacked figure blocks (Total Scope 1, 2, 3) with three years of numbers each. A thin all-caps running header reads "05 / IMPACT SUPPLEMENT / LULULEMON IMPACT REPORT 2022"; the slug footer sits bottom right.
Key takeaway
Treating a dense methodology appendix as a four-column editorial text grid with tiny all-caps labels, rather than a slab of paragraphs, so a reader can jump to the right note. Folding a small numeric summary into the same column rhythm keeps data and explanation unified.
Reuse notes
A strong reference for the notes, methodology, or basis-of-preparation pages of any ESG, GHG inventory, or financial report. The multi-column text grid with micro-labels handles a lot of disclosure text gracefully. Works best in print-style light mode with generous leading.
From this deck: Climate data methodology and emissions summary
View deck