Preview image. Unlock full-res
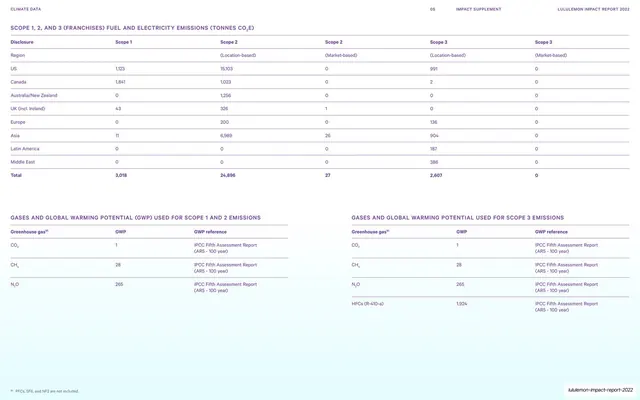
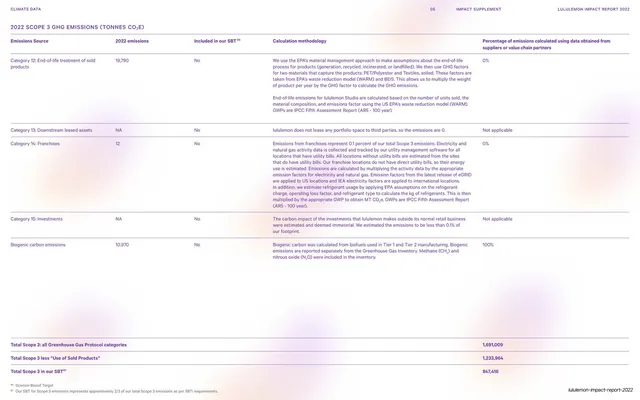
An emissions data page with a wide Scope 1, 2, 3 emissions table over two side-by-side global-warming-potential reference tables.
Summary
A climate-data page combining a full-width emissions-by-region table (in tonnes CO2e, location- and market-based) above two parallel reference tables listing greenhouse gases and their global warming potential factors.
Visual description
White 16:9 page. A small all-caps violet subhead "SCOPE 1, 2, AND 3 (FRANCHISES) FUEL AND ELECTRICITY EMISSIONS (TONNES CO2E)" tops a six-column table: Disclosure plus Scope 1, Scope 2 (Location-based), Scope 2 (Market-based), and two Scope 3 columns, with region rows (US, Canada, Australia/New Zealand, UK, Europe, Asia, Latin America, Middle East) on hairlines and a bold violet Total row. Below, two side-by-side tables headed "GASES AND GLOBAL WARMING POTENTIAL (GWP) USED FOR SCOPE 1 AND 2 EMISSIONS" and "...SCOPE 3 EMISSIONS", each listing CO2, CH4, N2O (and HFCs on the right) against GWP values and the IPCC AR5 reference. A single bottom footnote, thin all-caps running header "CLIMATE DATA / 05 / IMPACT SUPPLEMENT / LULULEMON IMPACT REPORT 2022", slug footer bottom right. Generous white space fills the lower third.
Key takeaway
Pairing the primary data table with its own methodology reference tables on the same page, so the numbers and the factors that produced them sit together. Letting the lower half breathe as white space keeps a heavy table page from feeling cramped.
Reuse notes
A reusable layout for any report that must show both results and the conversion factors or assumptions behind them (emissions, currency, units). The location-based vs market-based split column is a standard GHG-accounting pattern worth copying. Sits naturally between slides 75 and 77 in a climate-data appendix.
From this deck: Scope 1, 2, 3 emissions and GWP tables
View deck




































More like this





Keep what you find
A free account saves references to boards and can send you a weekly email of picks based on what you save.
To see every result, go Pro.