Preview image. Unlock full-res
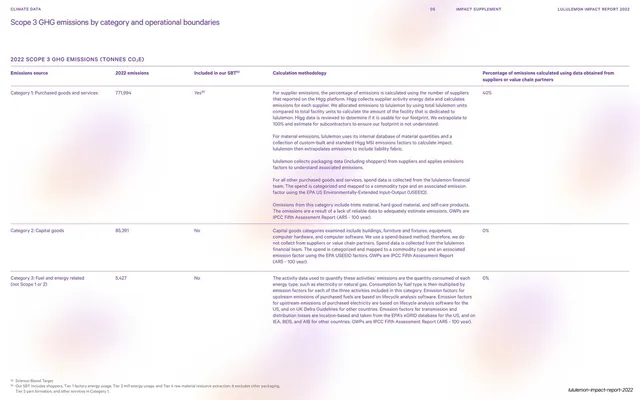
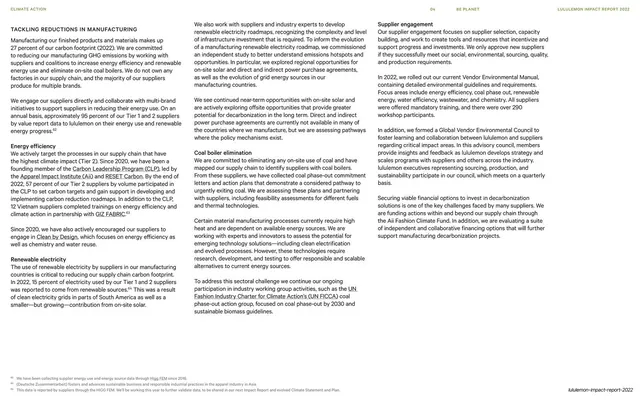
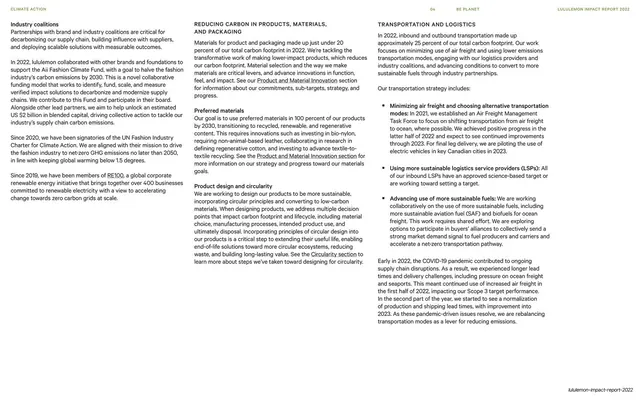
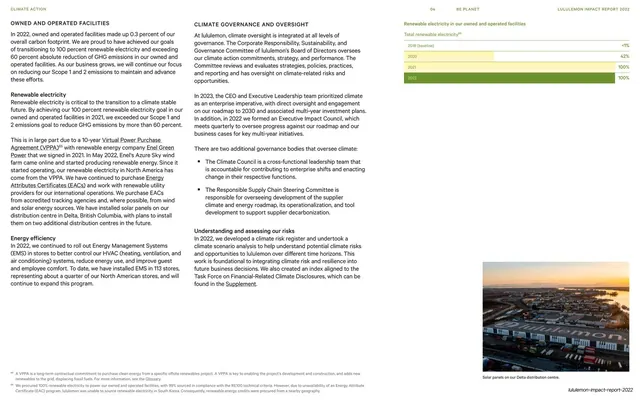
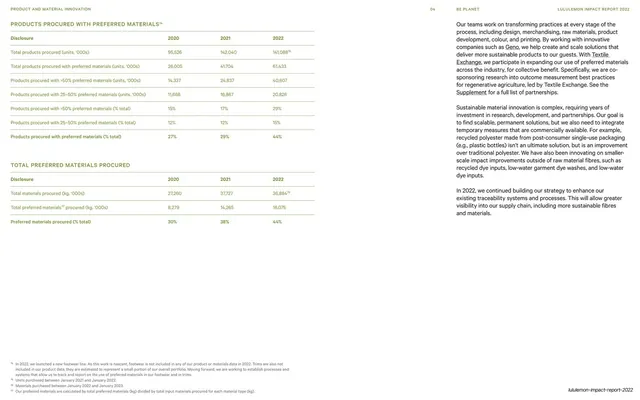
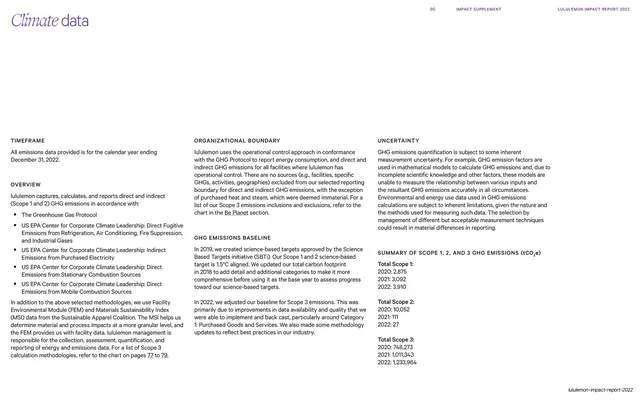
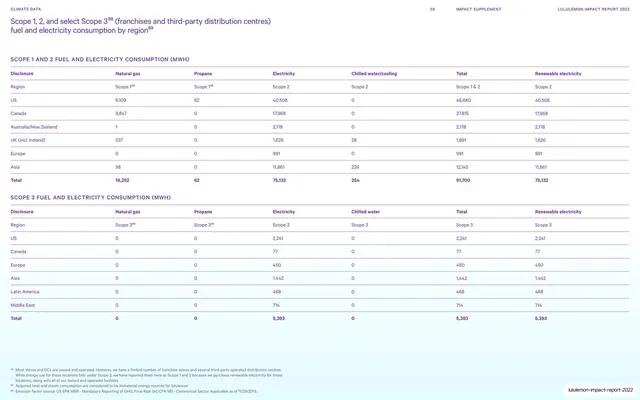
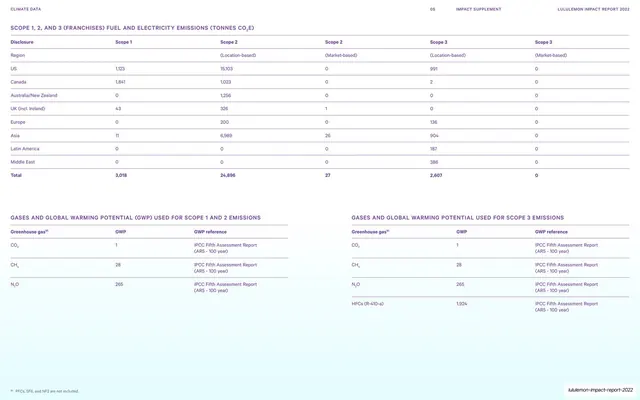
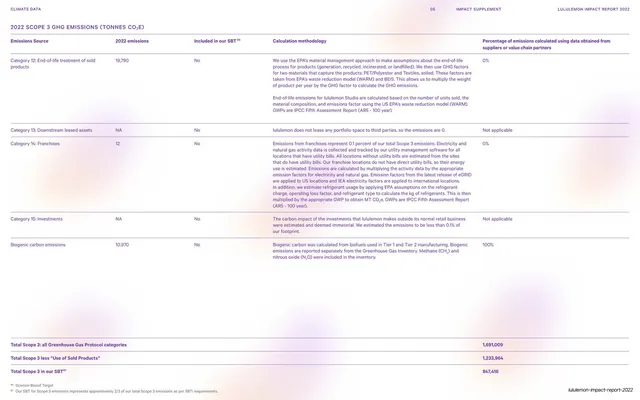
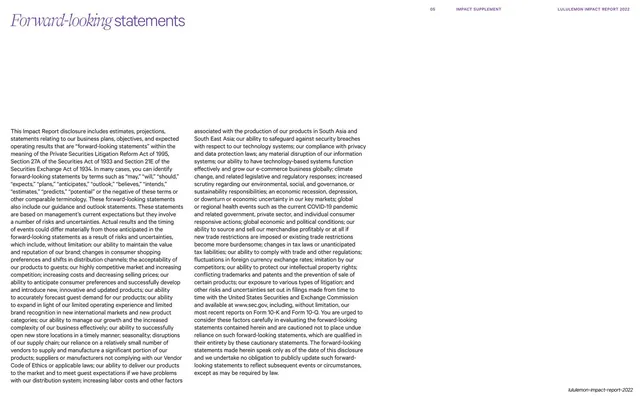
A Scope 3 emissions appendix page presenting categories, methodology, and coverage as a mix of explanatory columns and a categorized data table.
Summary
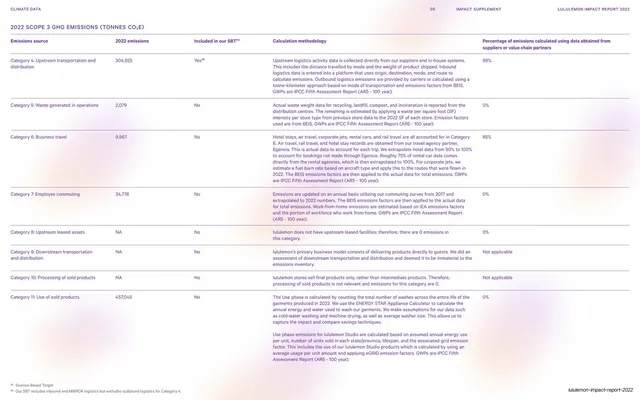
A Scope 3 emissions methodology page breaking down the upstream categories with their calculation approach and coverage, structured as labeled columns over a ruled data table.
Visual description
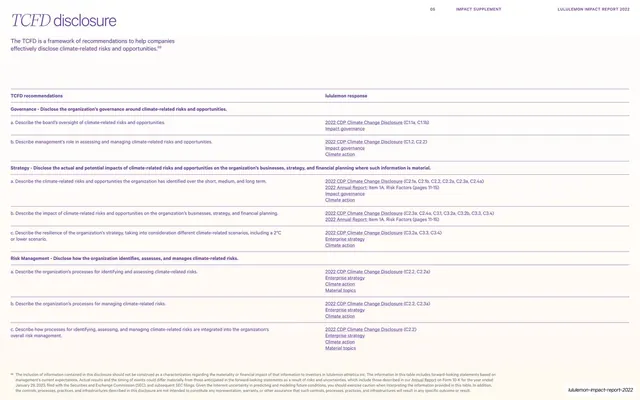
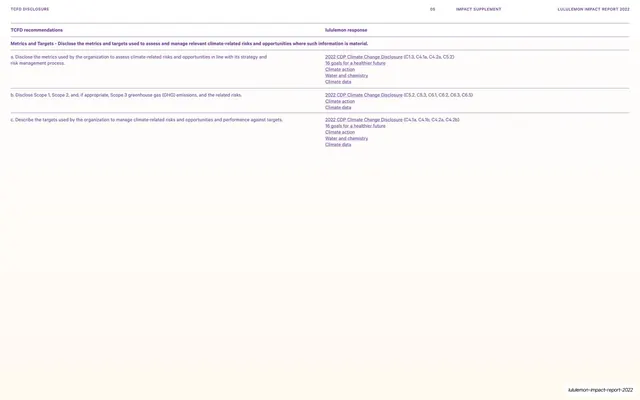
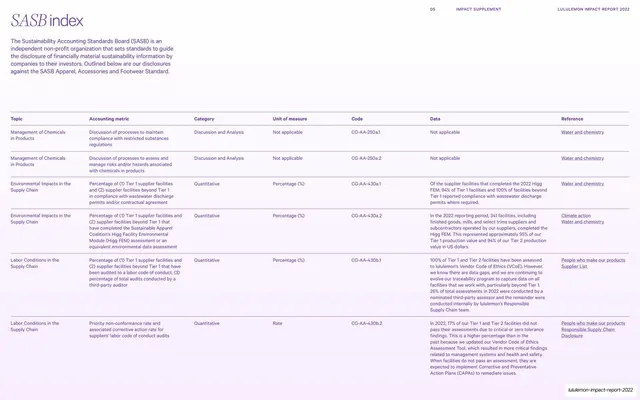
White 16:9 page in the climate-data appendix system. A short violet headline at top left introduces the Scope 3 categories. The body uses small dark-grey sans copy in narrow columns under tiny all-caps category labels (the standard GHG Protocol Scope 3 categories), describing methodology and coverage. A ruled table with hairline rows aligns category names against descriptive cells and figures, violet column headers carrying the structure. A thin all-caps running header "CLIMATE DATA / 05 / IMPACT SUPPLEMENT / LULULEMON IMPACT REPORT 2022" runs across the top; the slug footer sits bottom right. Lower portion of the page is open white space.
Key takeaway
Documenting a complex multi-category accounting method by interleaving short labeled text blocks with a tight reference table, so each category's logic and its number live next to each other. The consistent violet-header-on-white system makes a long appendix feel like one continuous chapter.
Reuse notes
A good model for any disclosure that must explain per-category methodology, not just report totals (Scope 3 inventories, audit scopes, survey coverage). Reuses the exact climate-data page furniture from slides 74 to 76, reinforcing how a fixed template carries many dense pages.
From this deck: Scope 3 emissions categories and methodology
View deck







































More like this





Keep what you find
A free account saves references to boards and can send you a weekly email of picks based on what you save.
To see every result, go Pro.