Preview image. Unlock full-res
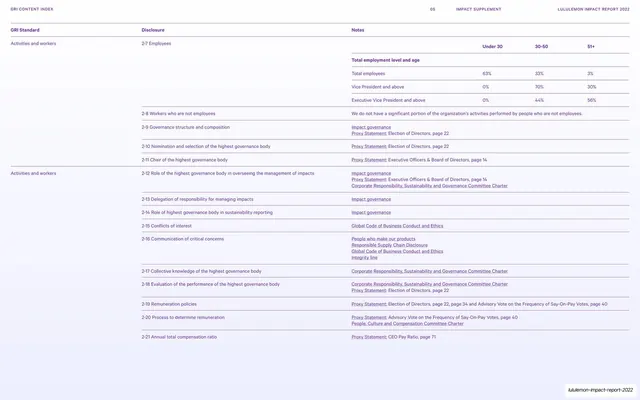
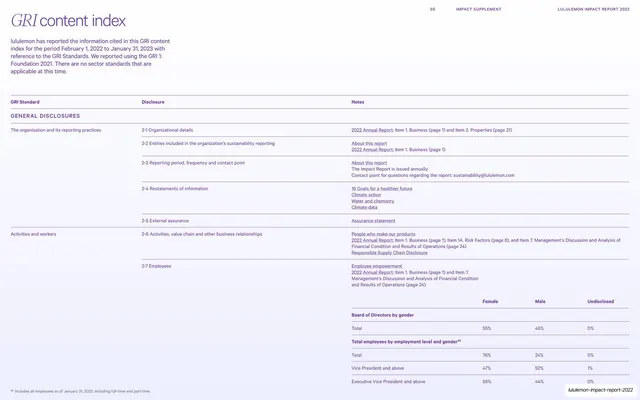
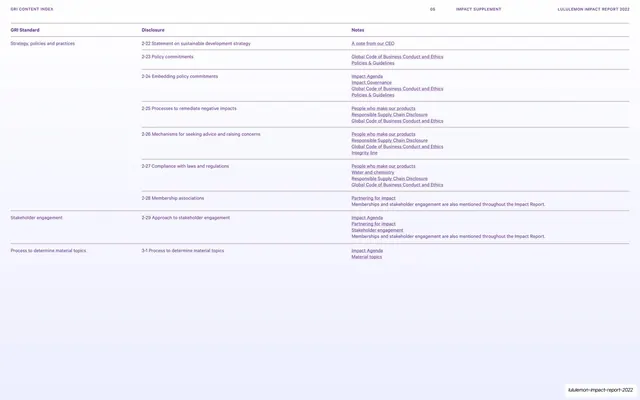
A GRI content index page detailing the 2-7 Employees disclosure with an employment-band data table broken out by headcount tiers.
Summary
A GRI index page expanding the 2-7 Employees disclosure: a standard-and-notes row over a quantitative employment table that buckets headcount into "Under 30", "30-50", and "51+" bands with percentage values.
Visual description
White 16:9 page in the GRI index system. A small all-caps violet "GRI CONTENT INDEX / 05 / IMPACT SUPPLEMENT / LULULEMON IMPACT REPORT 2022" runs across the top. The familiar three-column structure (GRI Standard / Disclosure / Notes) carries the 2-7 Employees row. Below, a wide data table presents employment demographics with bold column heads "Under 30 / 30-50 / 51+", rows for total employees, vice president and above, and executive vice president and above, and percentage figures aligned in each cell on hairline rules. A "Total employees" row and gender-related sub-rows give the only emphasis as bold values. A footnote sits at the bottom; slug footer bottom right.
Key takeaway
Turning a single GRI disclosure into a full demographic table with clearly labeled headcount bands, so one row of a crosswalk expands into real data when the topic warrants it. The age-band column heads read instantly without any chart.
Reuse notes
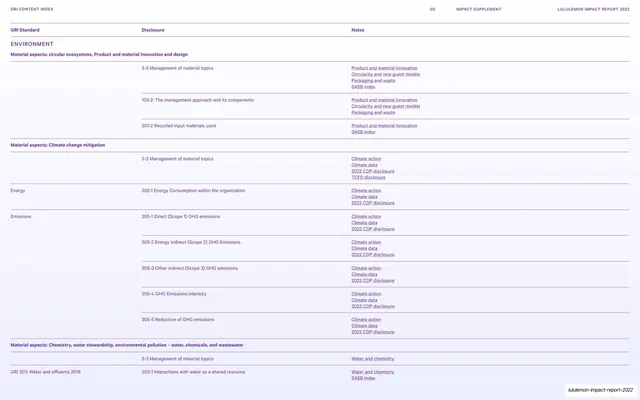
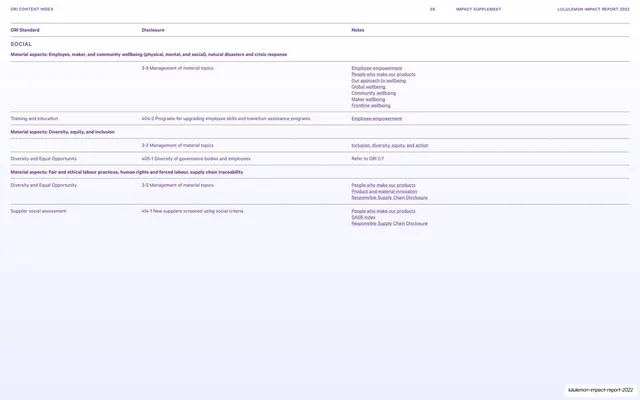
Reuse for workforce, diversity, or any banded-demographic disclosure inside a standards index. The "expand one index row into a dedicated table" move connects it to slide 84. Part of the GRI run (slides 84 to 88).
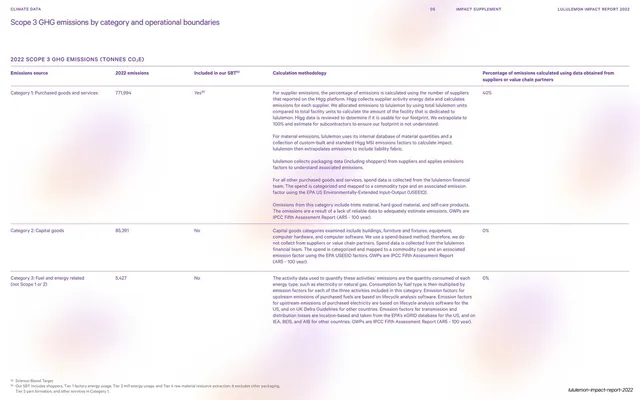
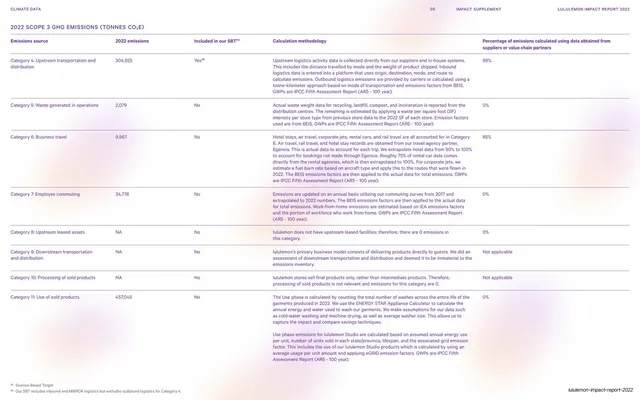
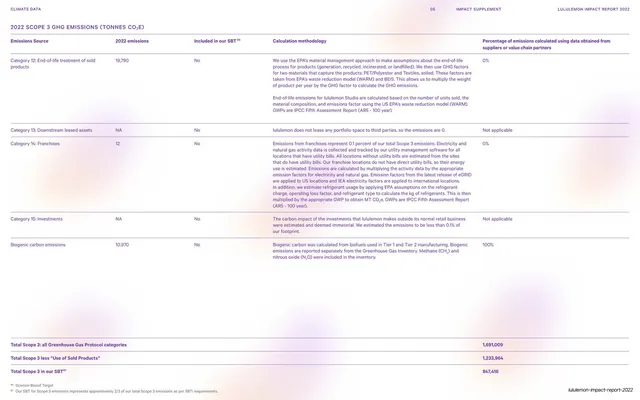
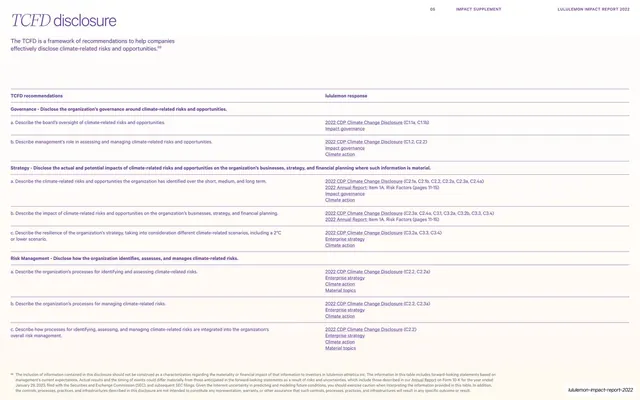
From this deck: GRI content index employment demographics
View deck


























More like this



Keep what you find
A free account saves references to boards and can send you a weekly email of picks based on what you save.
To see every result, go Pro.