Preview image. Unlock full-res
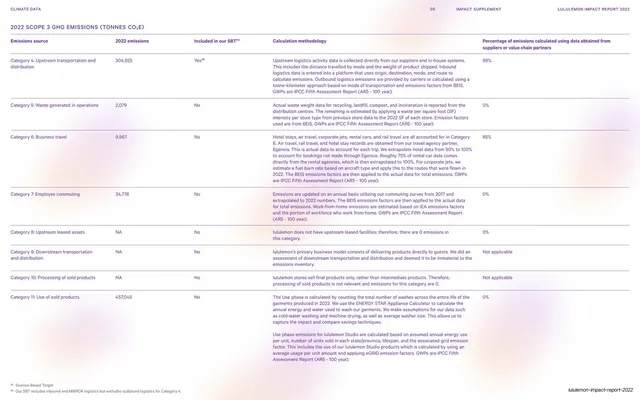
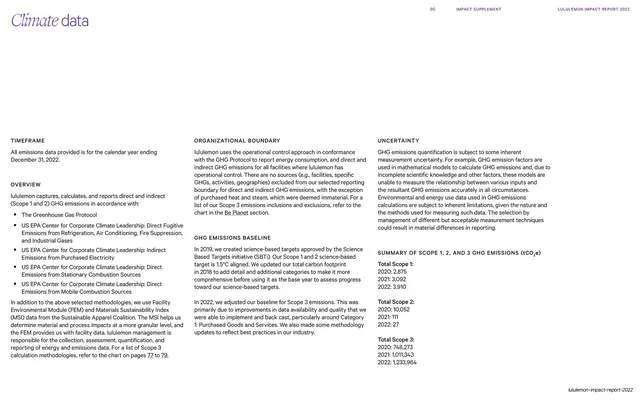
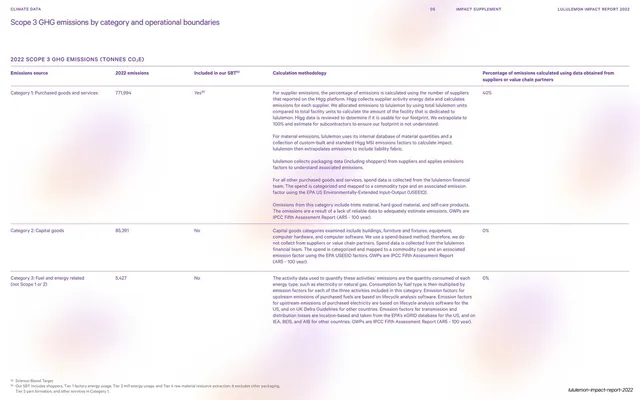
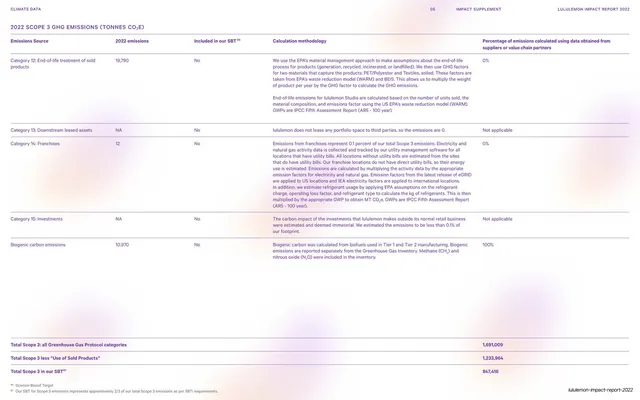
A Scope 3 closing page mixing methodology notes with a three-year emissions summary table and a calculation-percentage reference column.
Summary
The closing Scope 3 page: remaining upstream and downstream categories described in labeled columns, with an emissions summary table reporting figures across three years and a percentage-calculated reference column.
Visual description
White 16:9 page in the climate-data appendix system. Two text columns of small dark-grey sans copy under all-caps category labels describe the methodology for the later GHG Protocol Scope 3 categories, with the Greenhouse Gas Protocol source list as an indented bulleted set. A right-hand emissions table with hairline rows reports values across multiple years; a "Percentage of emissions calculated using data obtained from suppliers or value chain partners" column appears at far right with figures like 40%. Violet headers and totals provide the only emphasis. A thin all-caps running header runs across the top, footnotes at the bottom, slug footer bottom right.
Key takeaway
Closing a long multi-page data section by combining the final categories, a consolidated summary table, and a data-quality percentage column on one page, so the reader leaves with both the detail and a sense of how much is measured versus estimated. The recurring percentage-of-supplier-data column is an honest disclosure move.
Reuse notes
Reuse for the final page of any inventory or audit section that needs a roll-up plus a data-confidence indicator. The mixed narration-plus-summary-table layout matches the rest of this climate-data appendix, so it slots in cleanly after slide 77.
From this deck: Scope 3 categories and emissions summary
View deck


































More like this






Keep what you find
A free account saves references to boards and can send you a weekly email of picks based on what you save.
To see every result, go Pro.