Preview image. Unlock full-res
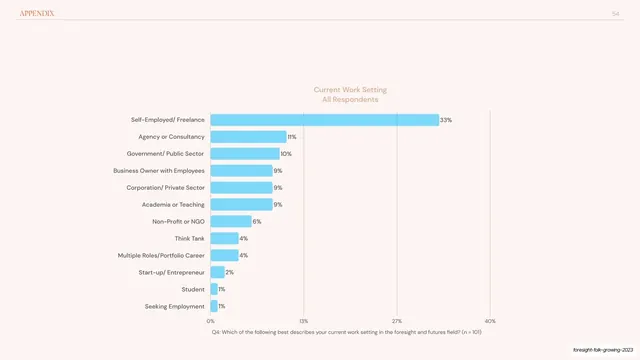
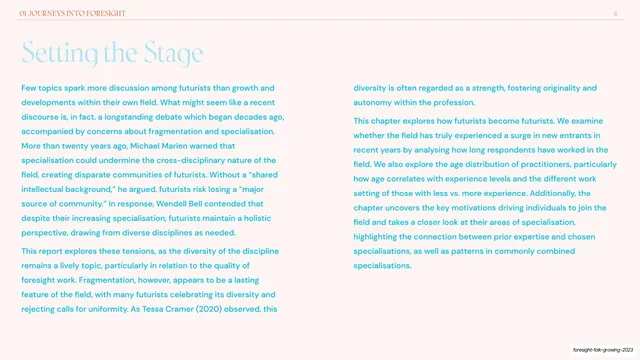
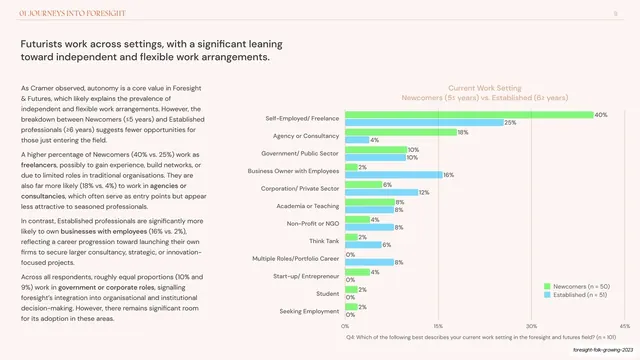
A centered appendix slide presenting a single-series horizontal bar chart of respondents' current work settings, sorted high to low.
Summary
A clean, centered appendix data slide showing a single horizontal bar chart that ranks respondents' current work settings from Self-Employed/Freelance down to Seeking Employment.
Visual description
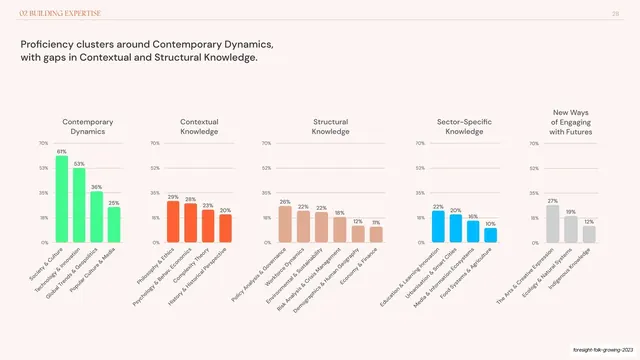
Light blush-cream background with no running chapter header, just the soft orange page number "54" top right on a hairline rule. A soft-orange two-line title, "Current Work Setting / All Respondents", is centered above the plot. A single-series horizontal bar chart fills the lower two-thirds: twelve cyan bars sorted longest to shortest, each labeled at left (Self-Employed/Freelance 33%, Agency or Consultancy 11%, Government/Public Sector 10%, down to Student and Seeking Employment at 1%) with its percentage printed at the bar's end. An x-axis runs 0% to 40% and a grey Q4 survey-question footnote sits beneath.
Key takeaway
Using horizontal bars, not vertical, for a ranked list of long category names: the labels read naturally at left and the sorted descending order makes the ranking obvious. End-of-bar data labels remove any guesswork, and a single accent color keeps it calm.
Reuse notes
The default choice whenever you have one series, many categories, and long labels. Sort descending so the chart tells the ranking story on its own. Keep the survey-question footnote for provenance. A clean standalone exhibit, good for an appendix data dump or a single key stat.
From this deck: Current work setting horizontal bar chart
View deck

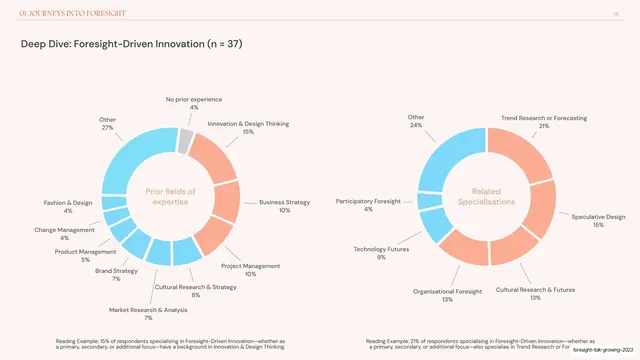
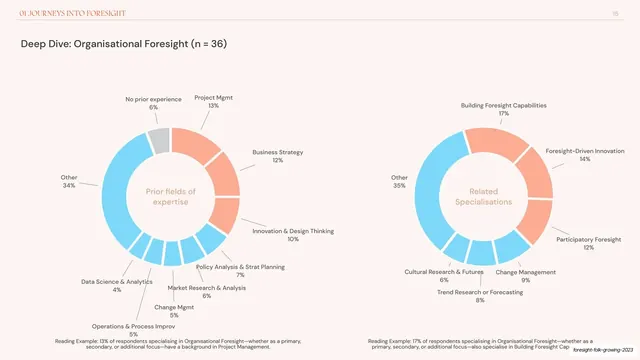
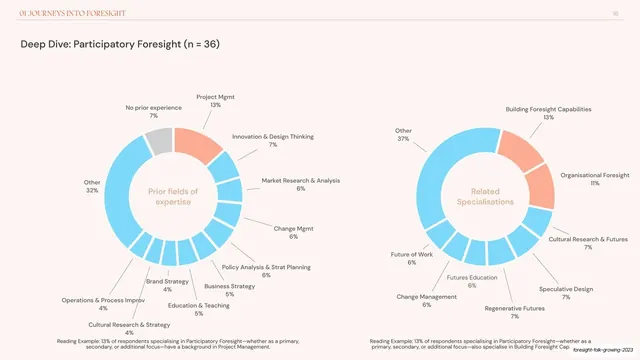
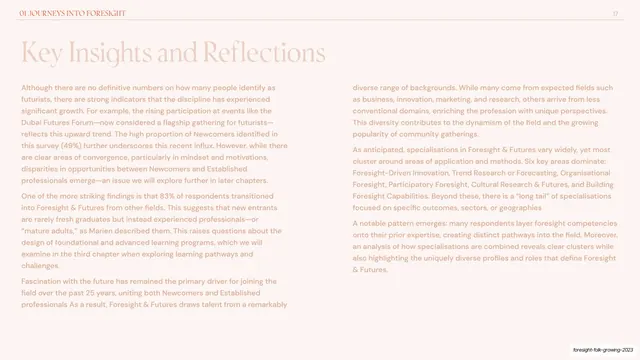




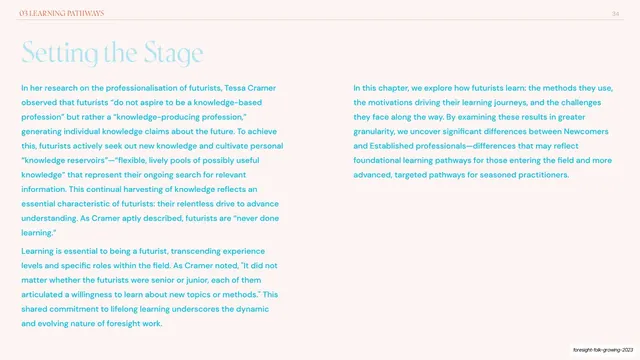
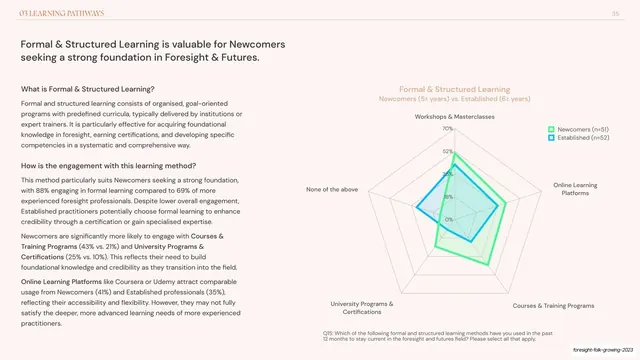
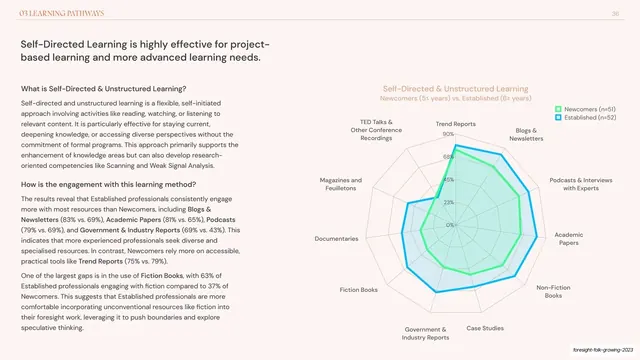
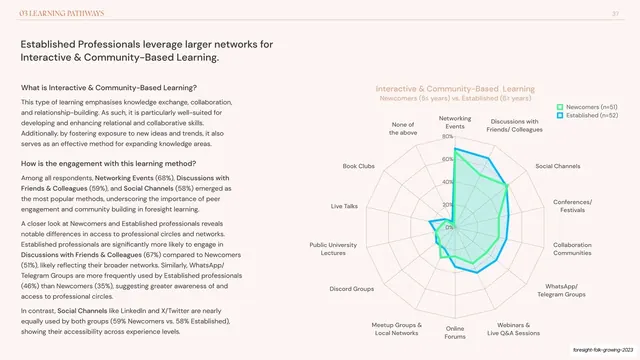
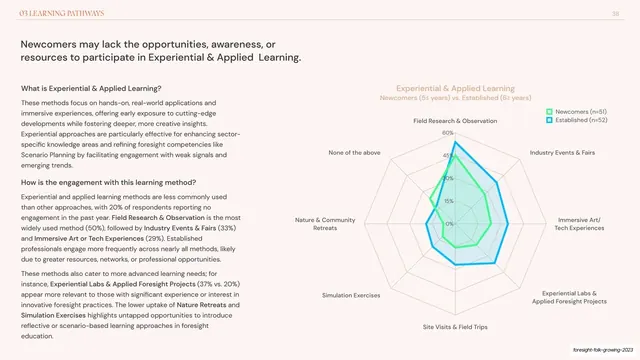
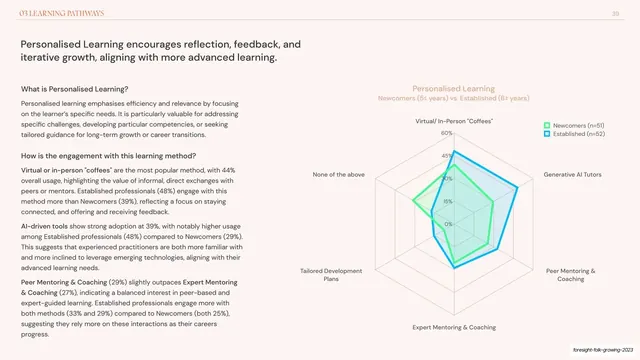
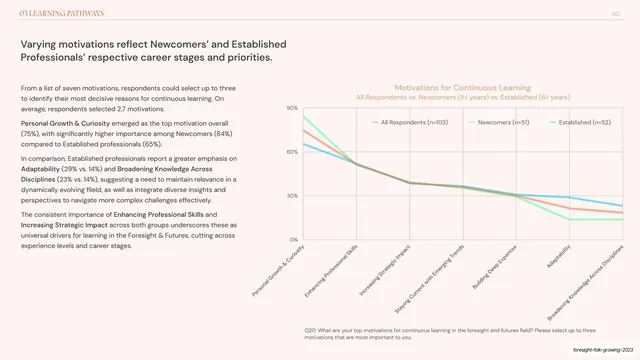
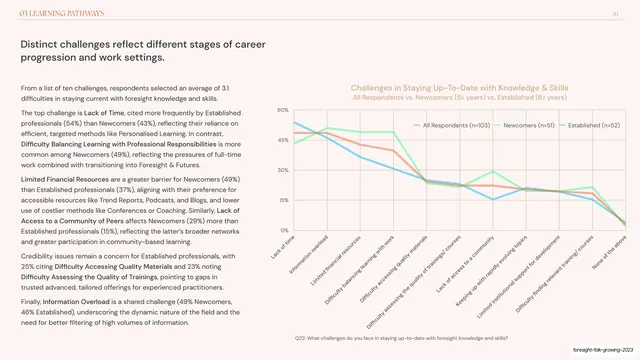






More like this




Keep what you find
A free account saves references to boards and can send you a weekly email of picks based on what you save.
To see every result, go Pro.