Preview image. Unlock full-res
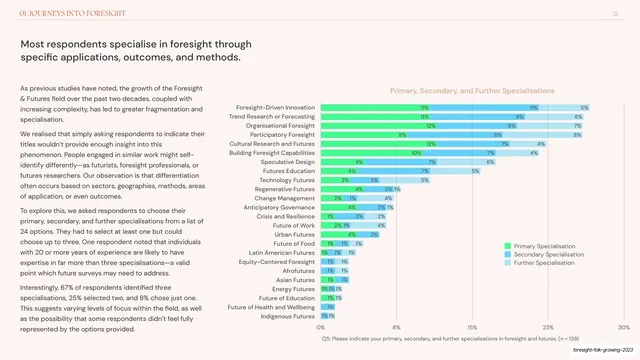
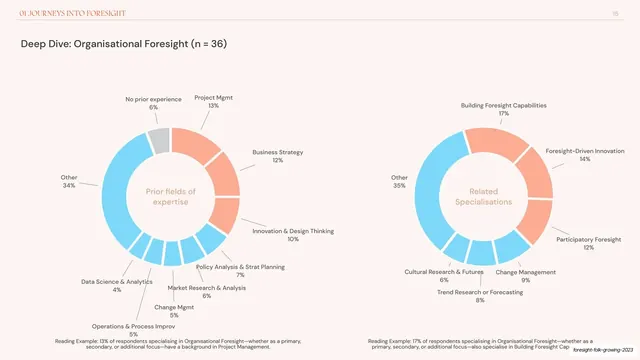
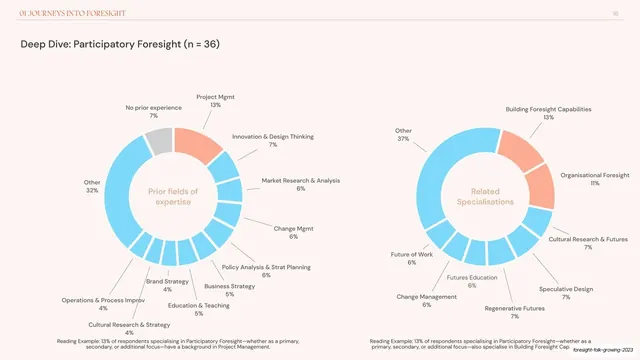
Dense data slide with two columns of copy beside a three-series green-and-blue stacked bar chart ranking foresight specialisations.
Summary
A high-density specialisations slide: two columns of copy beside a long three-series stacked horizontal bar chart breaking each specialisation into primary, secondary, and further focus.
Visual description
Blush-cream ground with the "01 JOURNEYS INTO FORESIGHT" header and page "12" on a hairline rule. The headline "Most respondents specialise in foresight through specific applications, outcomes, and methods." runs in a dark sans, top-left. The left holds two columns of body copy. The right is a long horizontal stacked bar chart titled "Primary, Secondary, and Further Specialisations", with around two dozen rows (Foresight-Driven Innovation and Trend Research or Forecasting at top, down to Indigenous Futures), each bar split into green (primary), darker-blue (secondary) and light-blue (further) segments with small percentage labels, a three-swatch legend, and an axis to 30 percent.
Key takeaway
Stacking three related series (primary / secondary / further) per row so a single chart shows both total prevalence and how central the specialisation is, across a long ranked list. The green-to-blue ramp reads as an ordered scale rather than unrelated categories.
Reuse notes
This is the densest chart pattern in the deck; it works because labels are small and the list is sorted. Use when you must show layered counts across many categories at once. If it gets unreadable, drop the smallest "further" series or split into two slides.
From this deck: Specialisations stacked bar with three series
View deck












More like this





Keep what you find
A free account saves references to boards and can send you a weekly email of picks based on what you save.
To see every result, go Pro.