Preview image. Unlock full-res
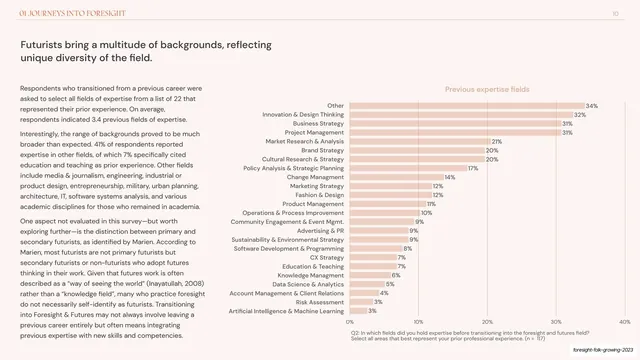
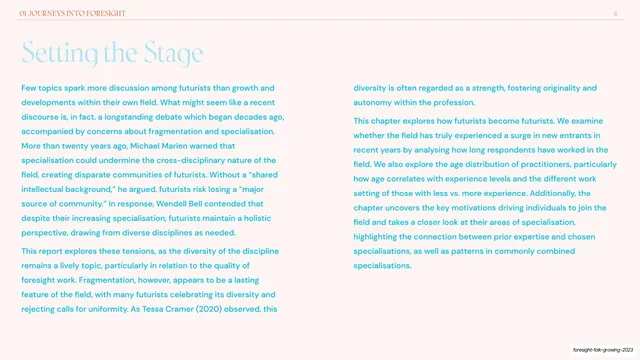
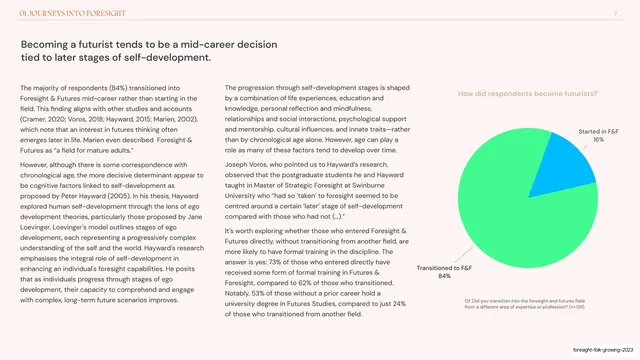
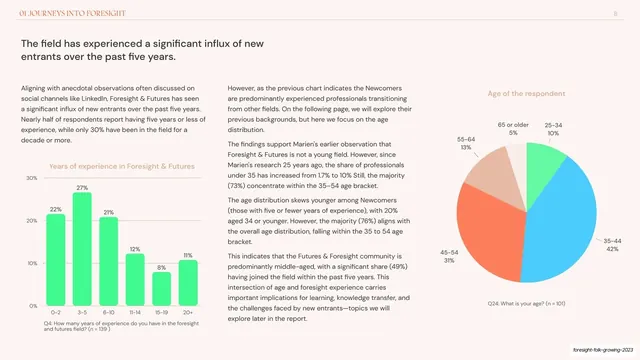
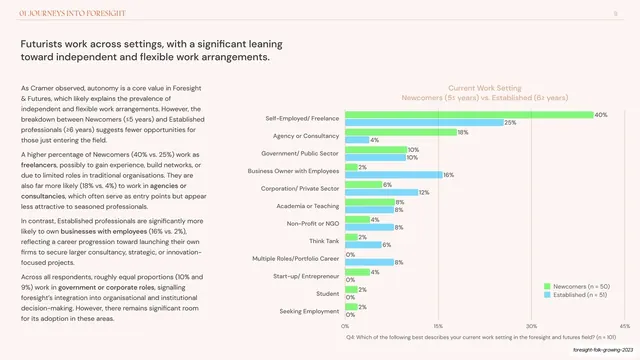
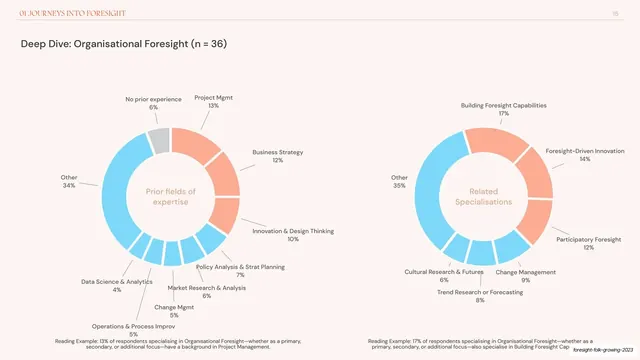
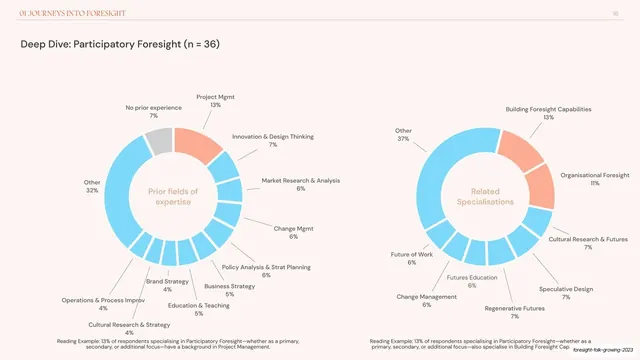
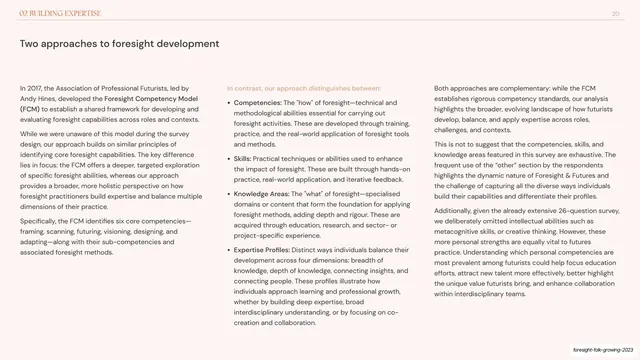
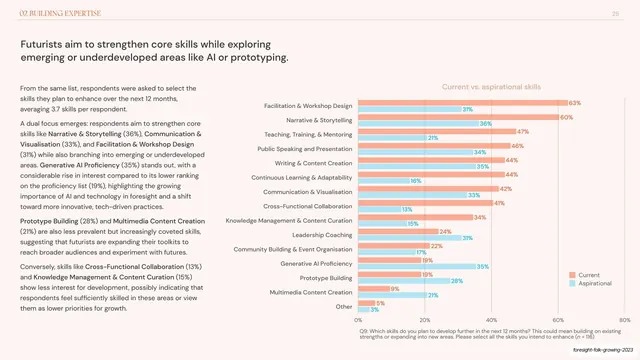
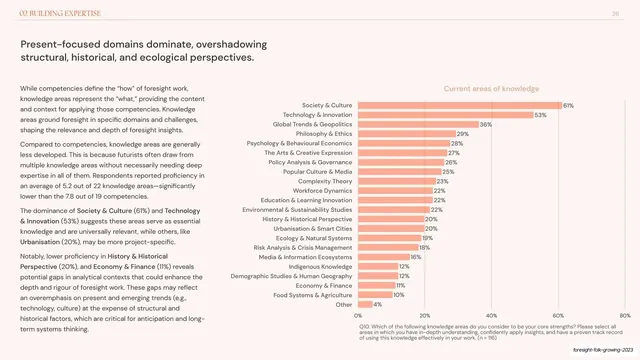
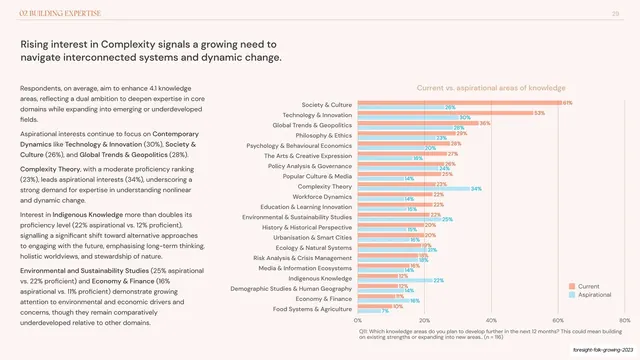
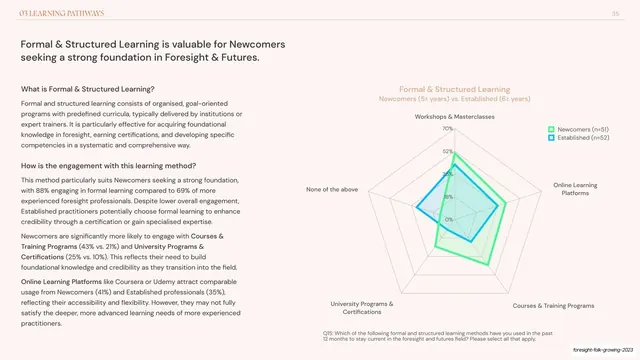
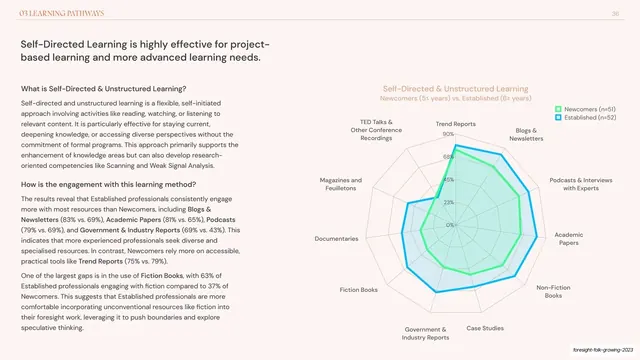
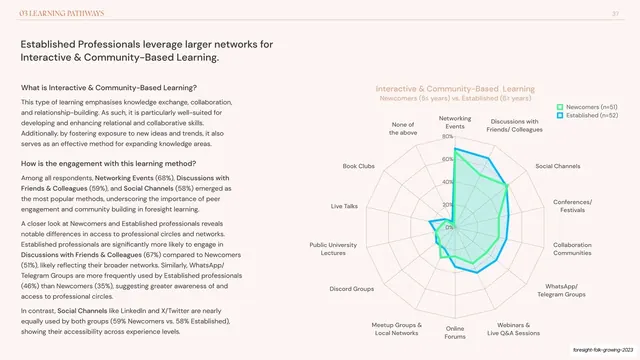
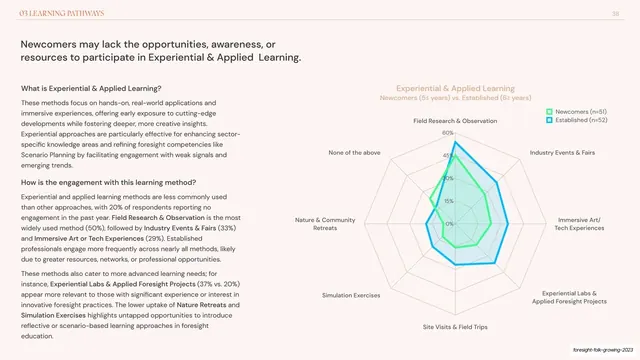
Data slide with two columns of copy beside a long single-color horizontal bar chart ranking many prior expertise fields.
Summary
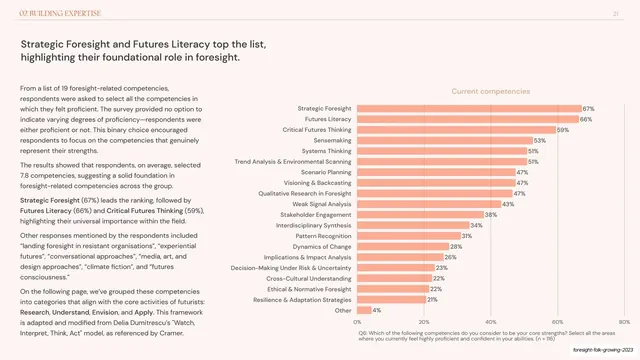
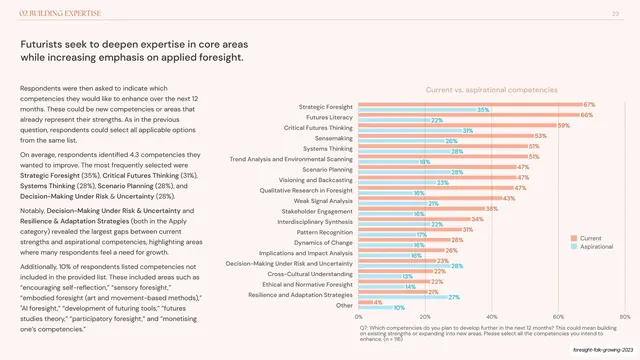
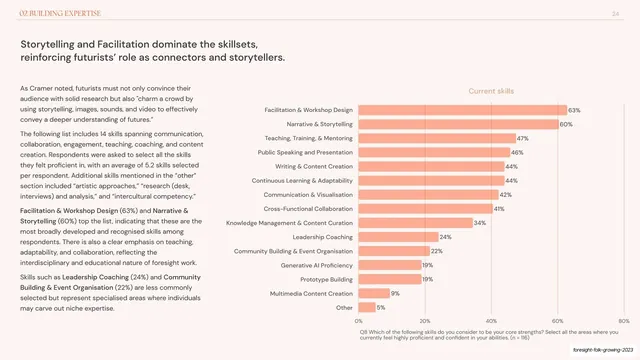
A ranked-list data slide: two columns of body copy on the left and a tall horizontal bar chart on the right ranking around two dozen prior expertise fields by share.
Visual description
Blush-cream ground with the "01 JOURNEYS INTO FORESIGHT" header and page "10" on a hairline rule. The headline "Futurists bring a multitude of backgrounds, reflecting unique diversity of the field." runs in a dark sans, top-left. The left half is two columns of body copy. The right half is a long horizontal bar chart titled "Previous expertise fields", each row a field (Other 34%, Innovation & Design Thinking 32%, Business Strategy 31% down to small single-digit categories) drawn as a single-color coral bar with its percentage label, all left-aligned to a shared axis, with a grey question caption beneath.
Key takeaway
The single-accent ranked bar chart for a "long tail" finding: one color, every category labelled, sorted high to low, so the shape of the distribution reads instantly. Using just coral here (rather than the multi-series palette) signals this is one variable, not a comparison.
Reuse notes
Best for ranking many categories of one metric where the order is the story. A long horizontal list scales gracefully; keep the labels left of or on the bars so they stay readable. Pair with concise copy since the chart itself carries most of the detail.
From this deck: Prior expertise fields long bar chart
View deck











More like this





Keep what you find
A free account saves references to boards and can send you a weekly email of picks based on what you save.
To see every result, go Pro.