Preview image. Unlock full-res
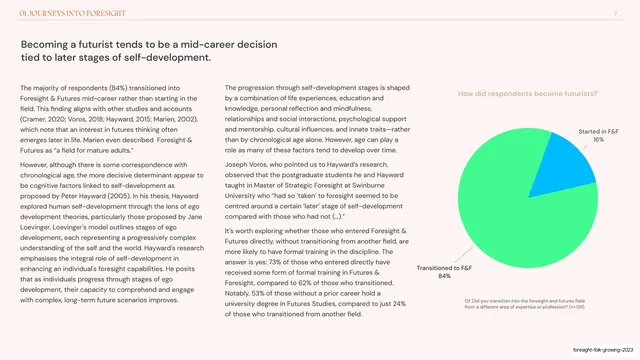
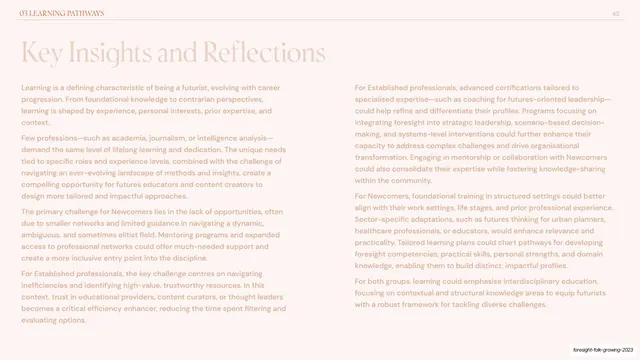
Data slide with a sans headline, two columns of copy, and a green-and-blue pie chart showing transition into the field.
Summary
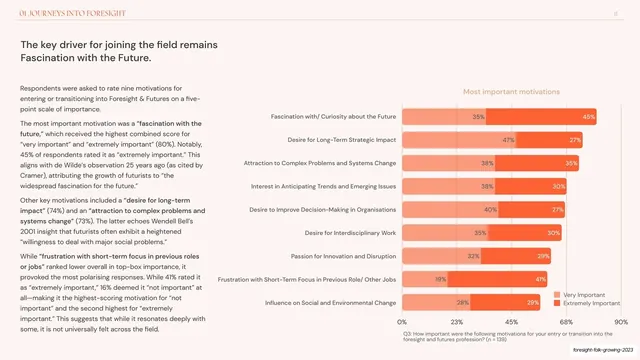
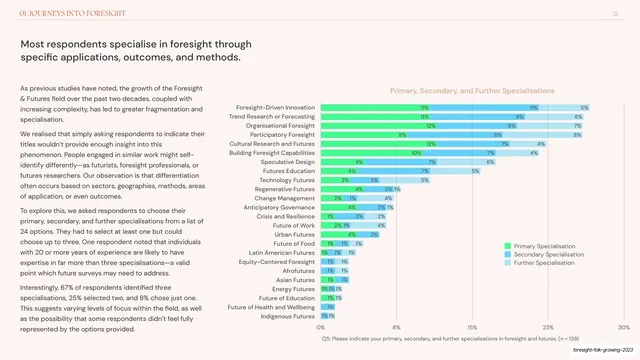
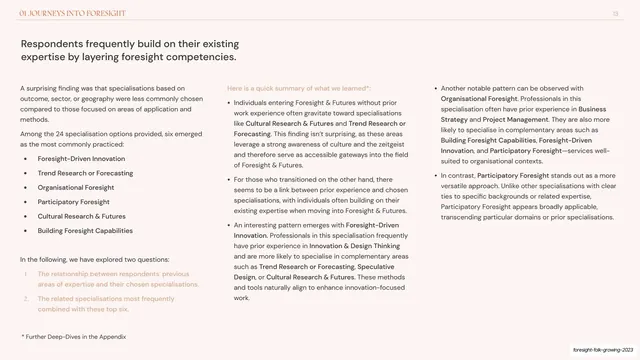
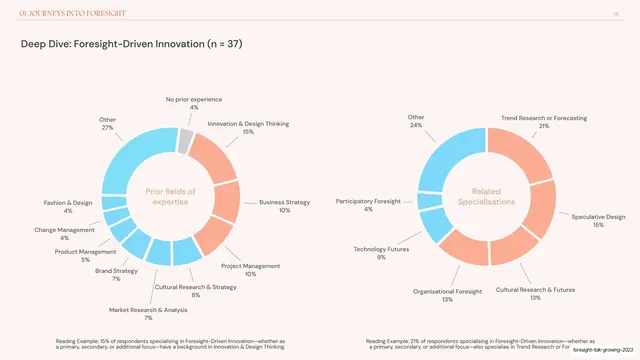
A representative data slide: a left-aligned sentence headline, two columns of body copy, and a single pie chart on the right captioned with its survey question.
Visual description
Blush-cream ground with the "01 JOURNEYS INTO FORESIGHT" running header and page "7" on a hairline rule. The headline "Becoming a futurist tends to be a mid-career decision tied to later stages of self-development." runs across two lines in a dark humanist sans, top-left. Beneath, body copy fills two columns. The right third holds a pie chart titled "How did respondents become futurists?", a large green wedge ("Transitioned to F&F 84%") with a smaller blue wedge ("Started in F&F 16%"), and a small grey caption giving the question and sample size. Type stays near-black; only the chart carries the green/blue accent.
Key takeaway
The standard data-slide grammar: full-sentence finding as the headline, supporting argument in two columns, and exactly one chart with its question and n labelled in small grey type. Keeping body text monochrome and letting only the chart hold color keeps a dense slide calm.
Reuse notes
The workhorse layout for any survey or research deck, repeatable across dozens of slides. Writing the takeaway as the headline (not "Q1 results") makes the deck skimmable. Leave the small question-and-sample caption on every chart for credibility.
From this deck: Mid-career decision pie-chart data slide
View deck













More like this





Keep what you find
A free account saves references to boards and can send you a weekly email of picks based on what you save.
To see every result, go Pro.