Preview image. Unlock full-res
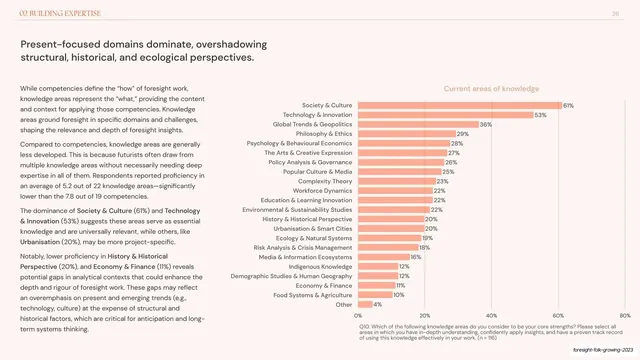
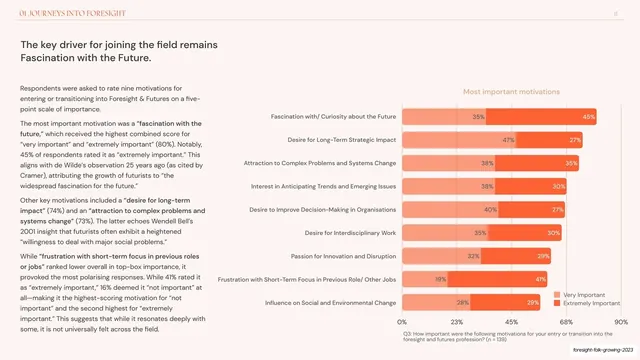
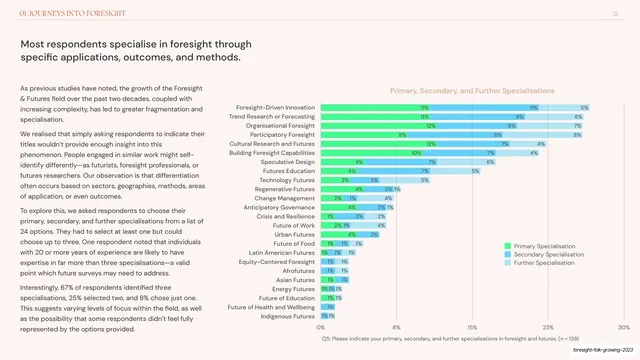
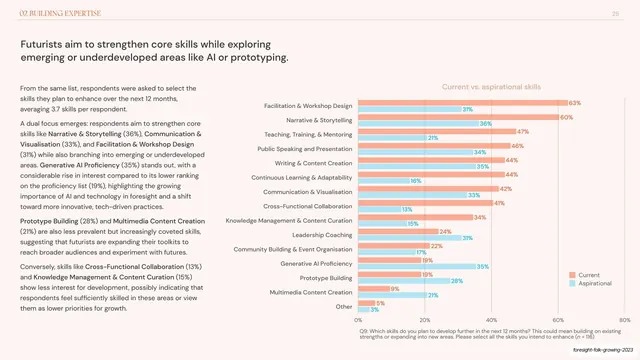
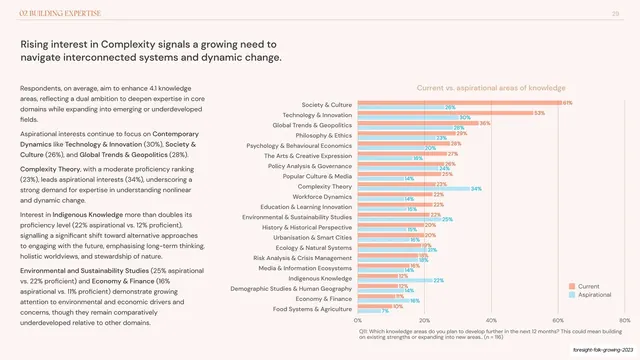
Data slide with a very long coral horizontal bar chart ranking 22 knowledge areas, led by Society and Culture, beside an analysis column.
Summary
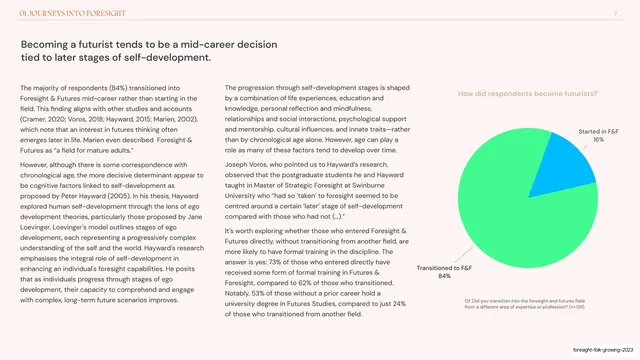
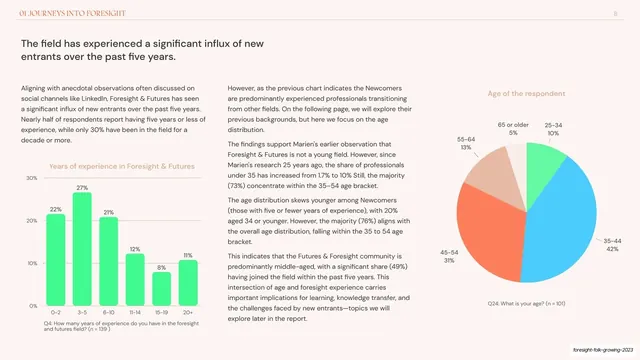
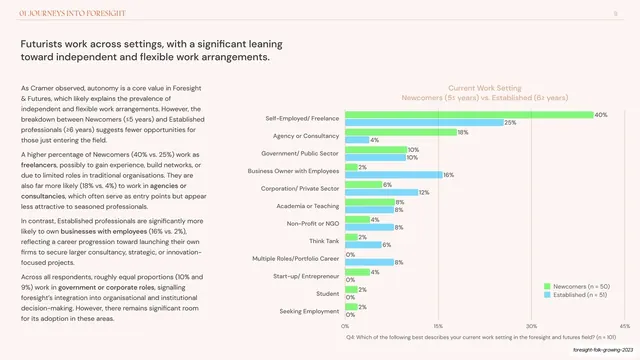
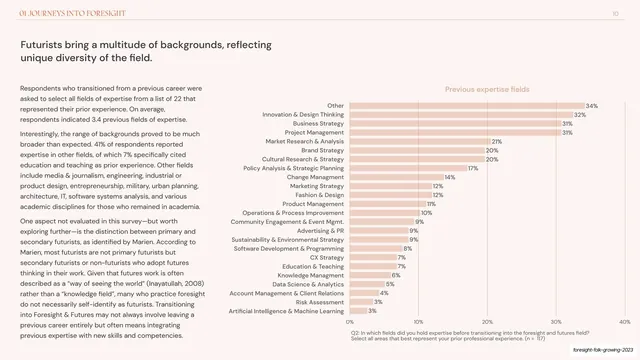
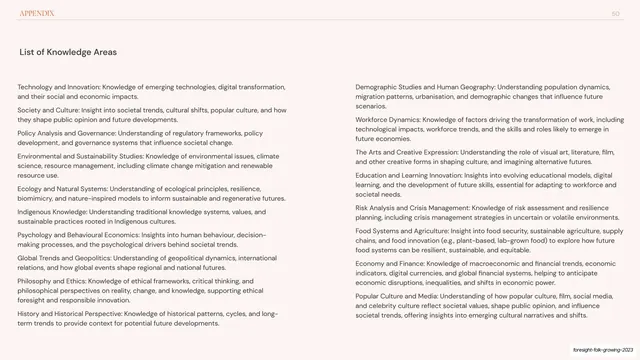
The knowledge-areas ranking: a tall coral horizontal bar chart of twenty-two areas from Society & Culture (61%) down to Food Systems & Agriculture (10%) and Other, with analysis on the left.
Visual description
Cream background, hairline running header (chapter label left, "26" right). Dark two-line headline at top. The left third holds three paragraphs of dark body copy with bold lead-in terms; the right two-thirds is the chart titled "Current areas of knowledge". Right-aligned labels meet salmon-coral bars, each ending in its percentage. The list is long (22 rows), so bars are thin and tightly stacked, forming a dense ranked column that tapers from 61% to single digits. Grey question footnote under the chart; deck-slug annotation bottom-right.
Key takeaway
How far the single-coral ranked-bar template scales: even at twenty-two rows it stays legible because the bars are thin, uniformly colored, and value-labelled. The consistent text-left/chart-right frame ties it to every other data slide in the chapter.
Reuse notes
Use when a survey has a long taxonomy to rank on one page. At this density the labels must stay short and the page is strictly for reading, not projection. If rows exceed roughly two dozen, consider splitting or grouping rather than shrinking bars further.
From this deck: Current areas of knowledge long bar chart
View deck














More like this






Keep what you find
A free account saves references to boards and can send you a weekly email of picks based on what you save.
To see every result, go Pro.