Preview image. Unlock full-res
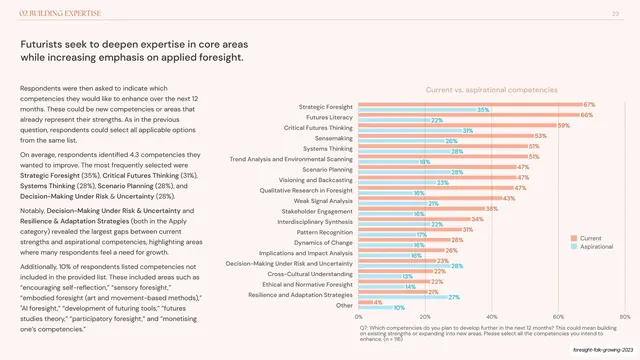
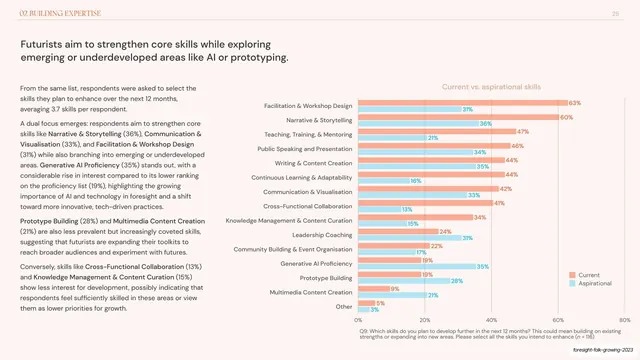
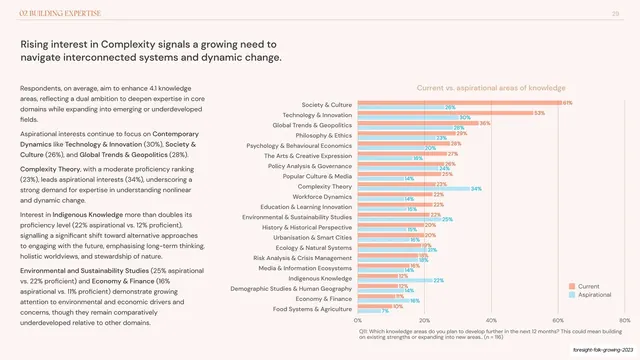
Data slide pairing current and aspirational competency scores as a two-color grouped horizontal bar chart beside an analysis column.
Summary
A grouped horizontal bar chart comparing each competency's current strength (coral) against aspirational interest (light blue), with a left column of written analysis.
Visual description
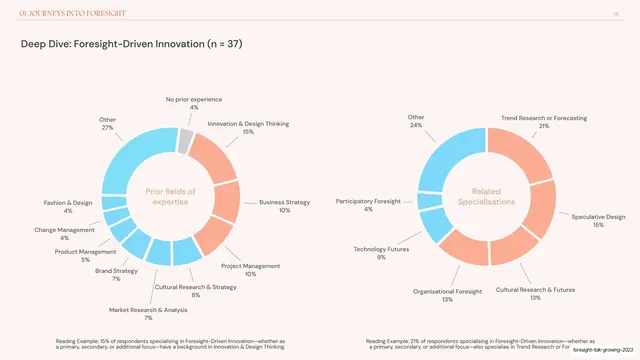
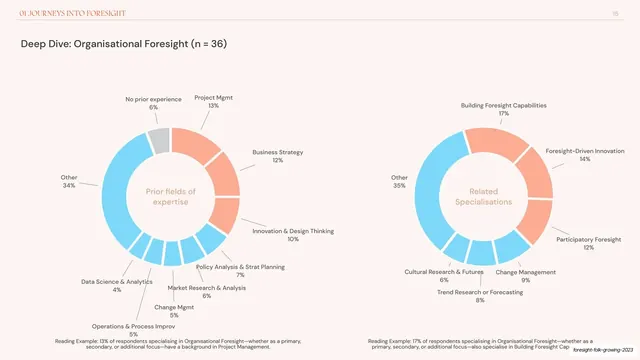
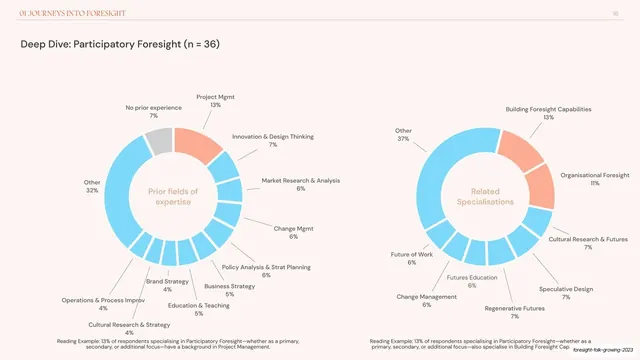
Cream background, hairline running header (chapter label left, "23" right). Dark two-line headline at top. The left third carries three paragraphs of dark body copy with bold terms; the right two-thirds is a chart titled "Current vs. aspirational competencies". Each competency row shows two stacked bars: a longer salmon-coral "Current" bar with its value, and a paler blue "Aspirational" bar beneath it, both labelled. A small legend keys the two colors at lower right of the plot. The doubled bars let gaps between current and aspirational pop visually. Grey question footnote under the chart; deck-slug annotation bottom-right.
Key takeaway
The paired-bar pattern for "now vs. wanted" data: two tints of the deck's palette, one row pair per item, gaps readable at a glance without a separate delta column. Carrying the same coral as the single-metric slides and adding only a quiet blue keeps the chart system coherent across the chapter.
Reuse notes
Ideal for survey decks reporting a before/after or actual/desired comparison across many items. Keep the two colors as a clear light/dark pair so the longer-vs-shorter read is instant. With this many rows it is a reading-distance document, not a projection slide.
From this deck: Current vs aspirational competencies paired bar chart
View deck









More like this




Keep what you find
A free account saves references to boards and can send you a weekly email of picks based on what you save.
To see every result, go Pro.