FREITAG Impact Report 2022
An 86-slide sustainability and impact report built on a strict Swiss grid, FREITAG yellow and black, a sans/monospace type pairing, and recurring blueprint detailing that frames every chart, diagram, and divider as an engineering document.
85 slides · Report
View deck overview
FREITAG Impact Report 2022 cover

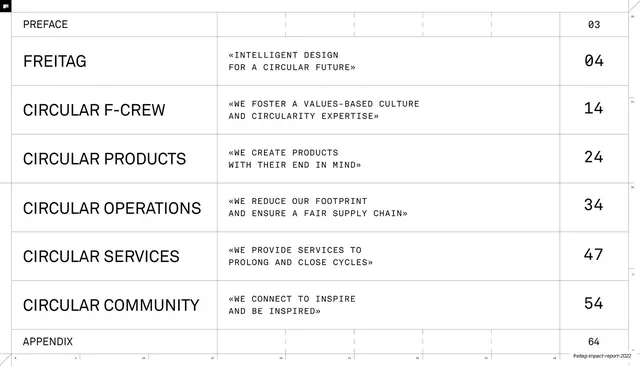
Report contents table

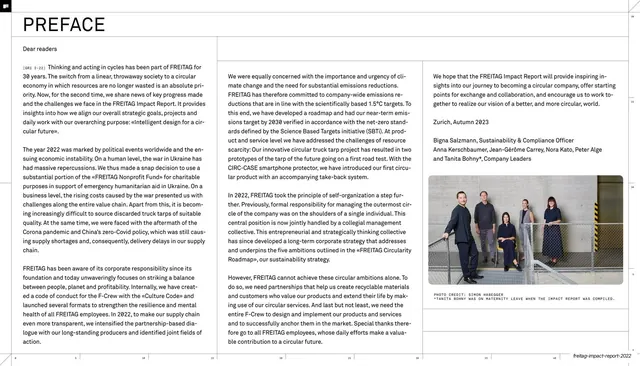
Preface letter spread

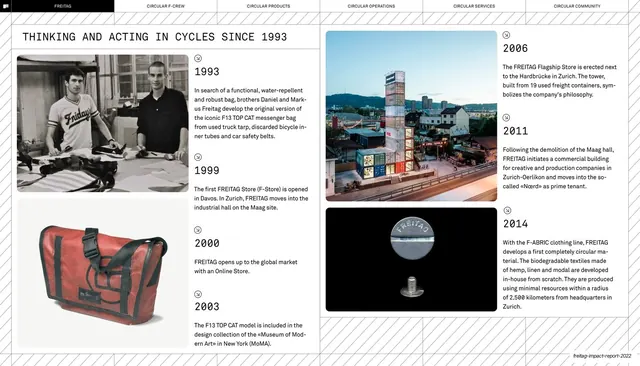
Company history timeline 1993 to 2014

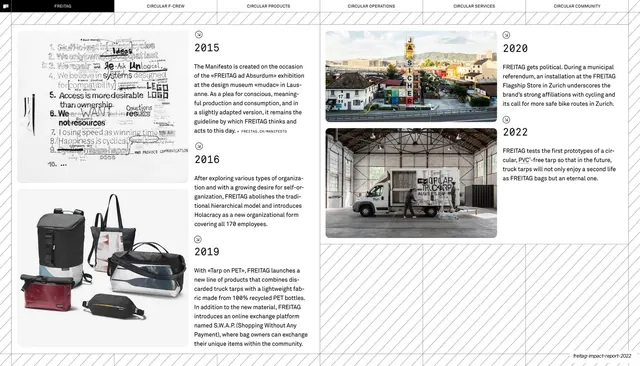
History timeline 2015 to 2022

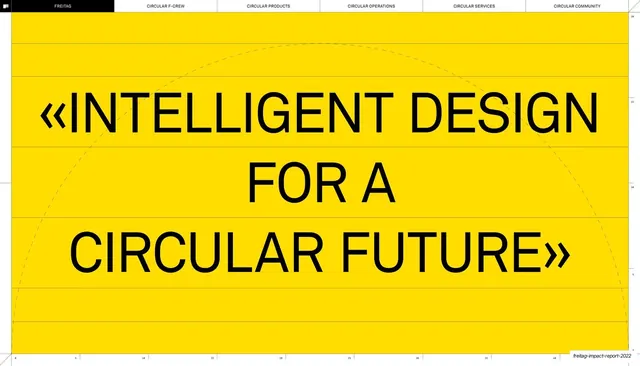
Intelligent design quote slide

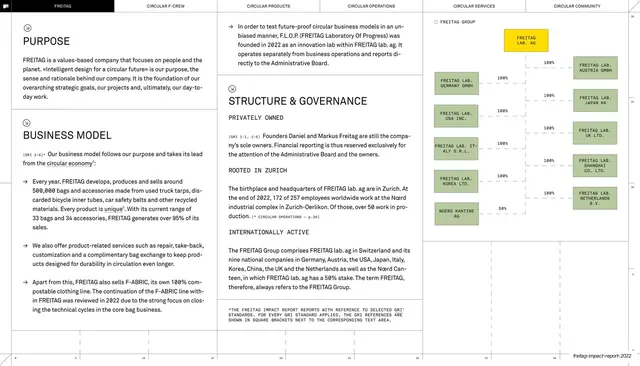
Purpose, business model and group structure

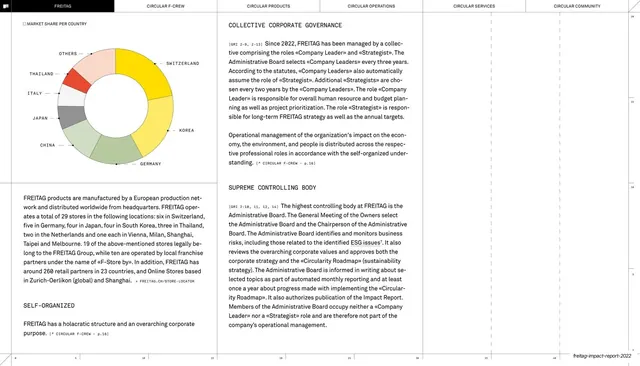
Corporate governance and global footprint

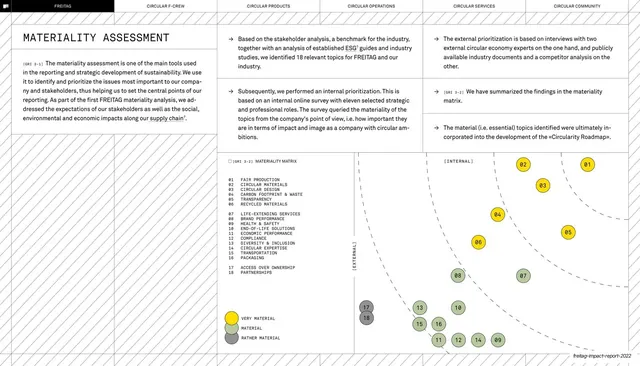
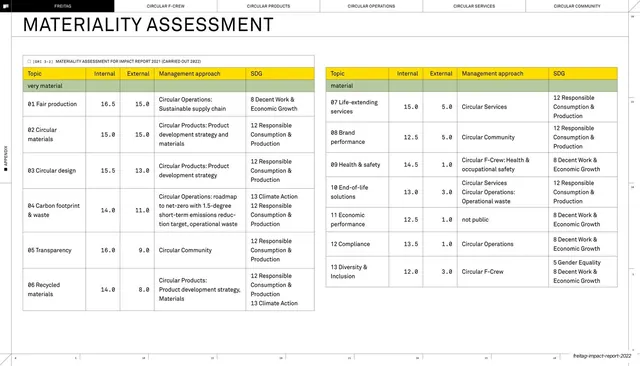
Materiality assessment matrix

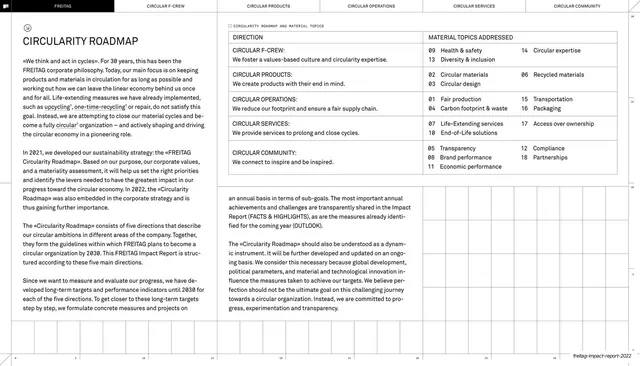
Circularity Roadmap directions table

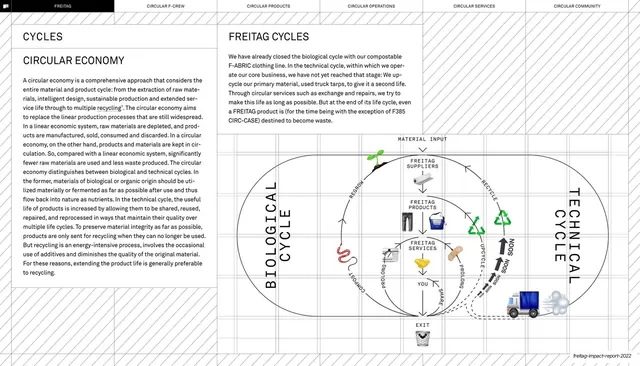
Circular economy cycles diagram

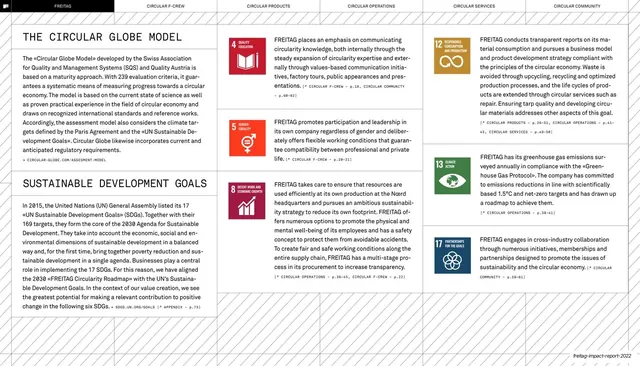
Circular Globe model and SDG alignment

Circular F-Crew section divider

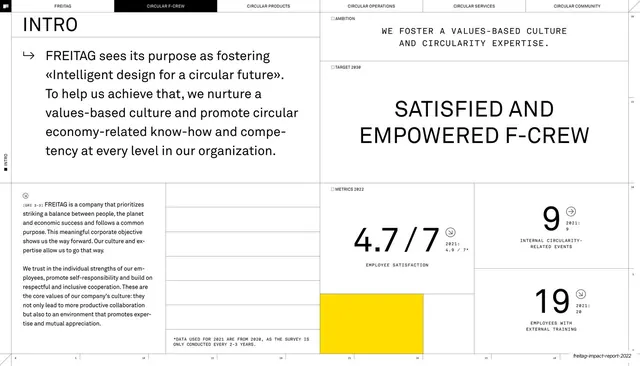
Satisfied and empowered F-Crew intro

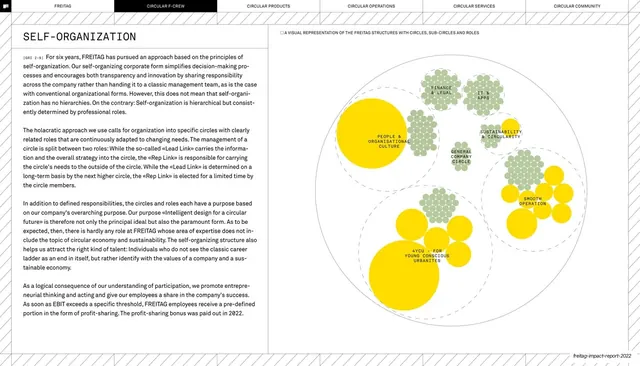
Self-organization circle structure

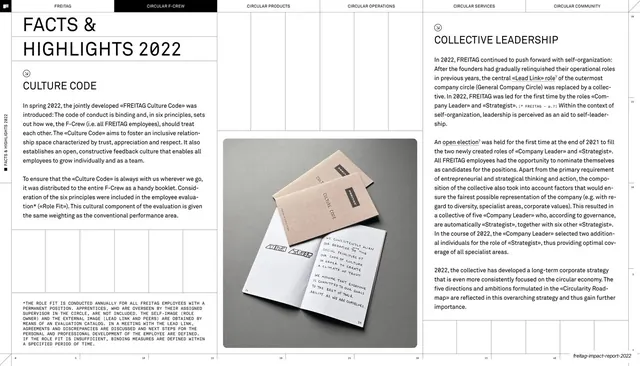
Facts and highlights, Culture Code

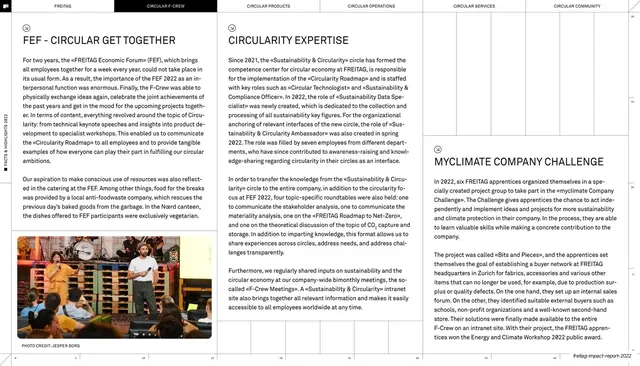
F-Crew get-together and MyClimate challenge

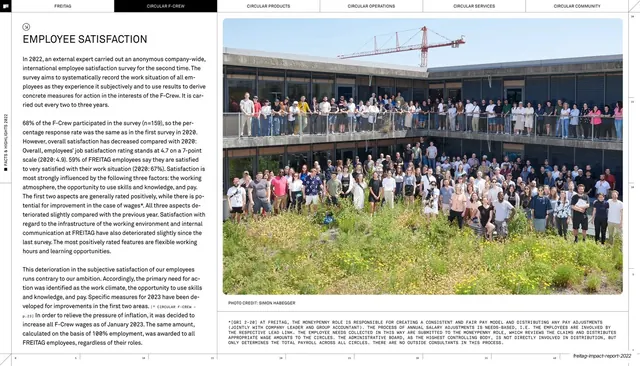
Employee satisfaction split text and crowd photo

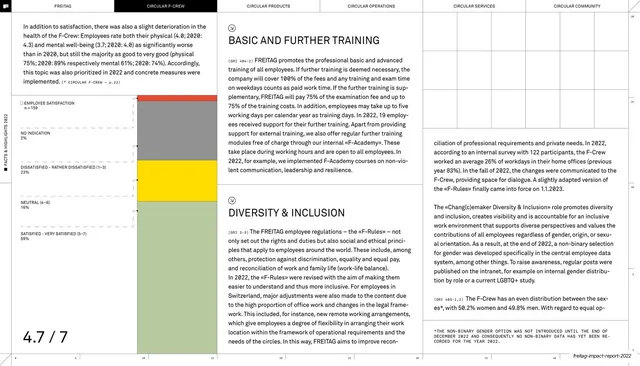
Training and inclusion with stacked bar and big stat

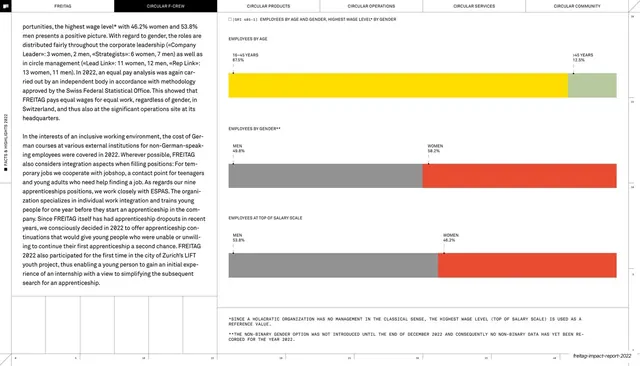
Employees by age and gender stacked bars

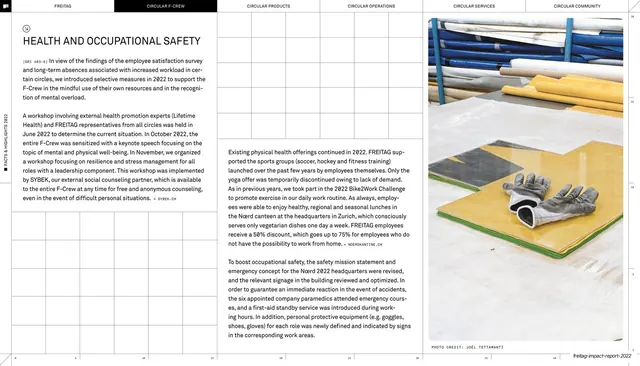
Health and safety split text and workshop photo

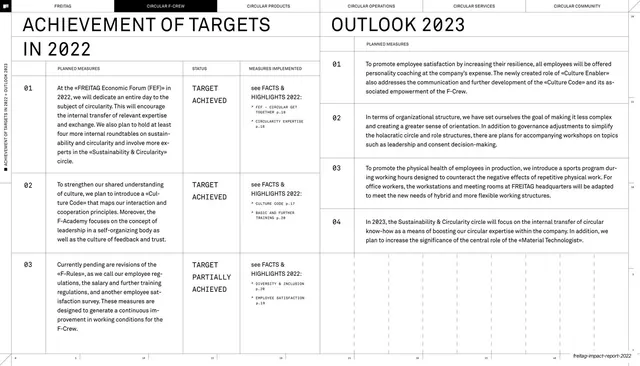
Achievement of targets 2022 and outlook 2023 table

Circular Products yellow technical-drawing divider

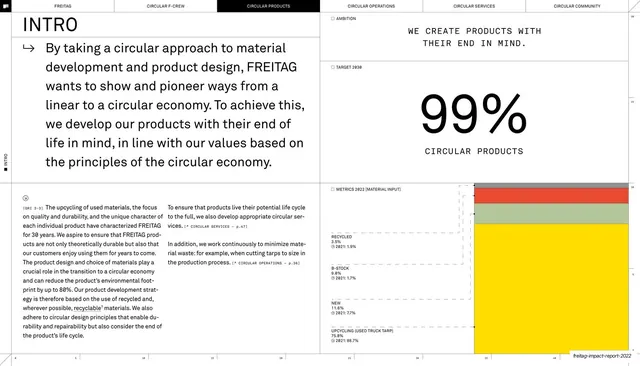
Circular products intro with oversized 99 percent stat

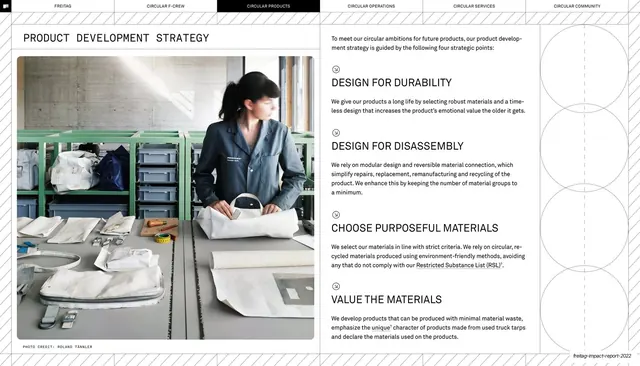
Product development strategy photo and four principles

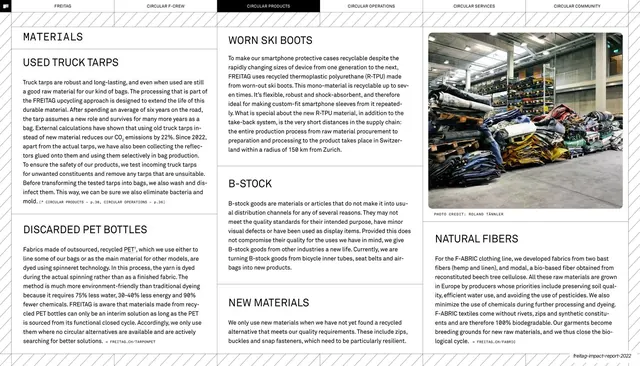
Materials feedstocks multi-column with warehouse photo

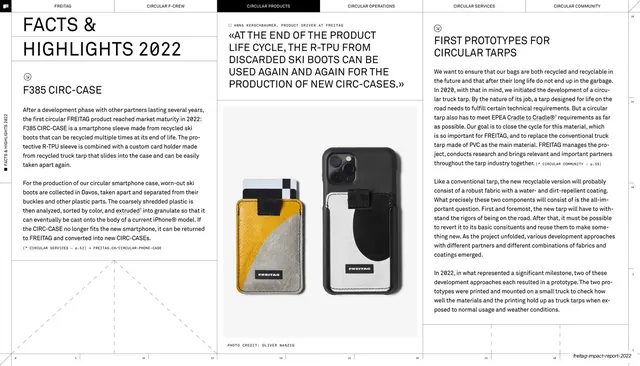
CIRC-CASE prototypes with pull quote and product photos

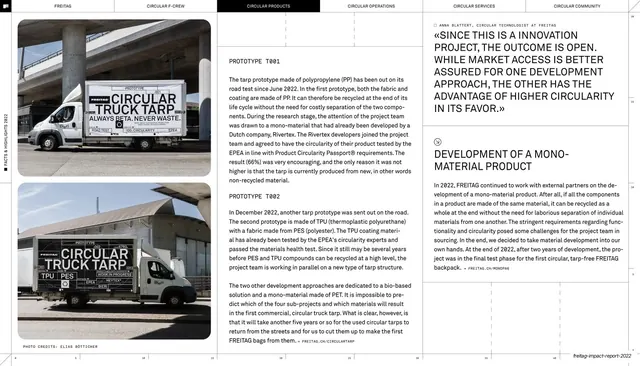
Mono-material prototypes with truck photos and pull quote

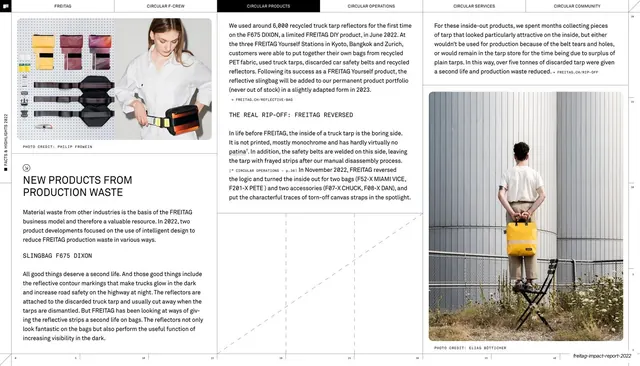
Products from production waste with lifestyle photos

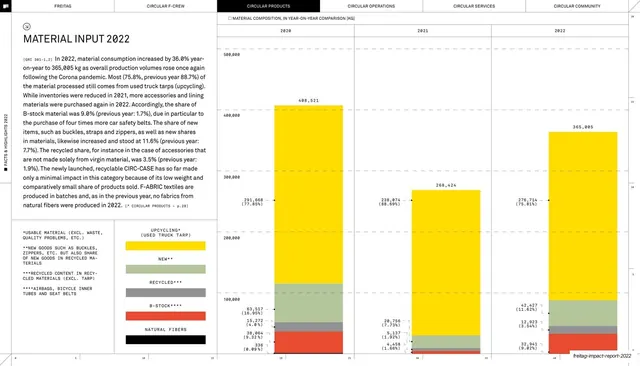
Material input 2022 year-on-year stacked bar chart

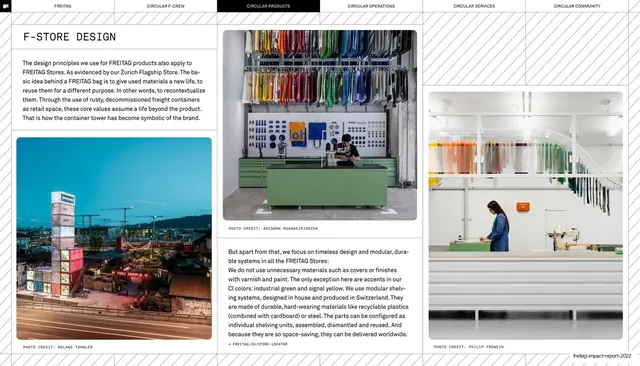
F-store design three-photo retail interiors page

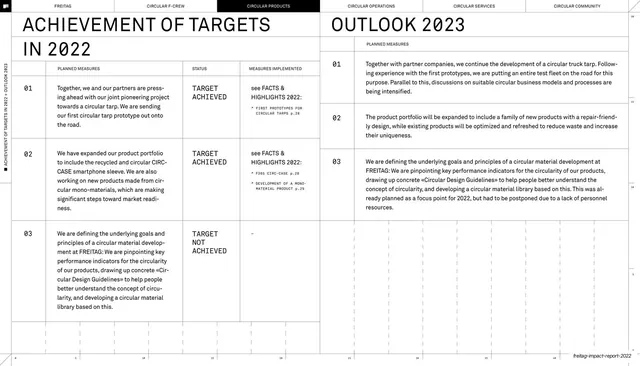
Products targets 2022 and outlook 2023 scorecard

Circular Operations yellow technical-drawing divider

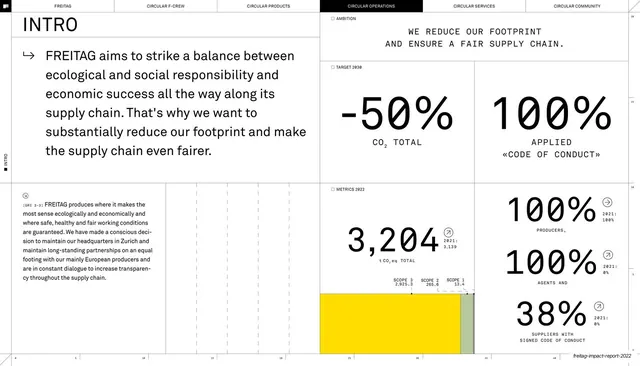
Operations intro with minus 50 percent and stat grid

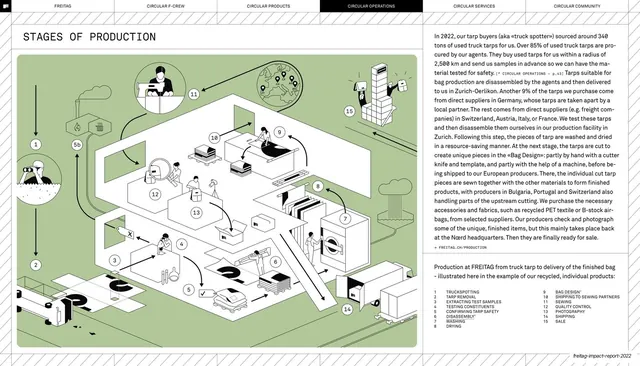
Stages of production isometric flow illustration

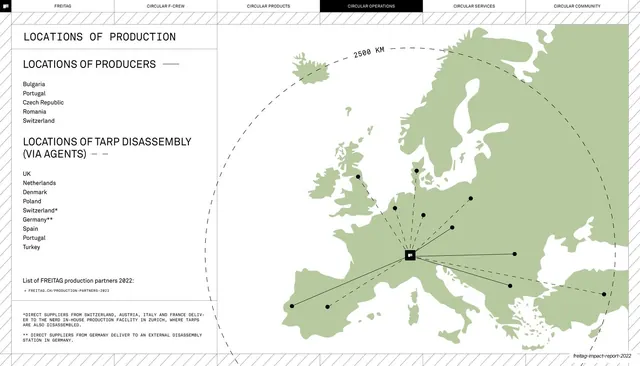
Locations of production map

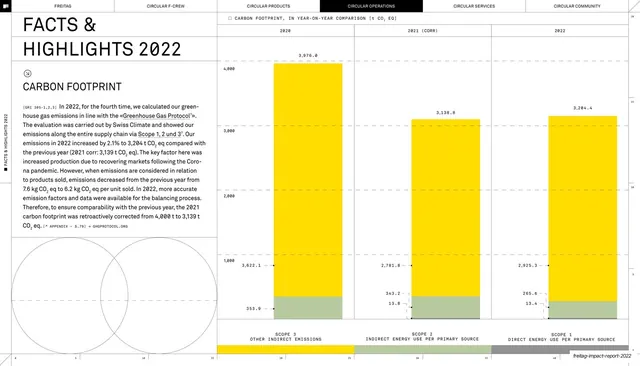
Carbon footprint year-on-year bar chart

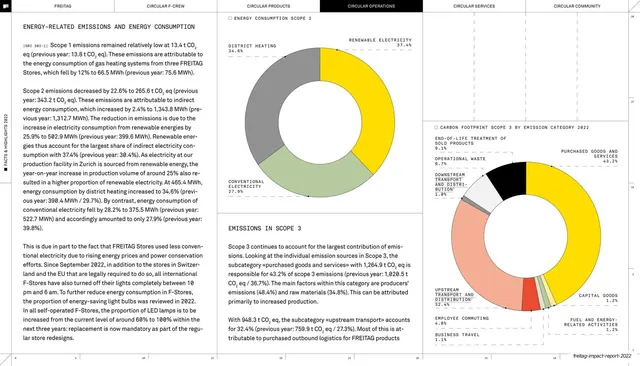
Energy emissions donut charts

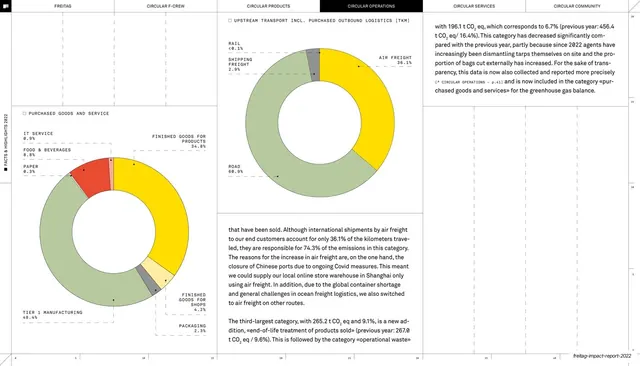
Transport and purchased goods donuts

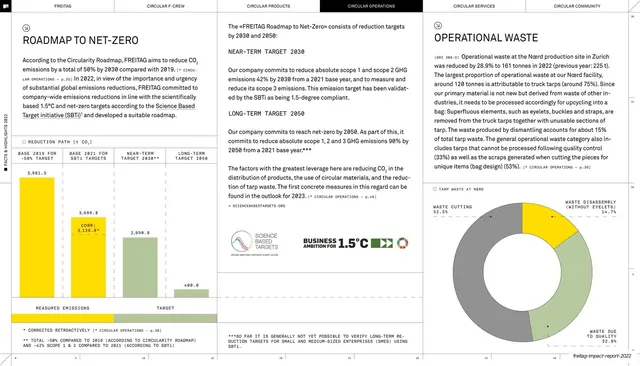
Roadmap to net-zero targets and waste

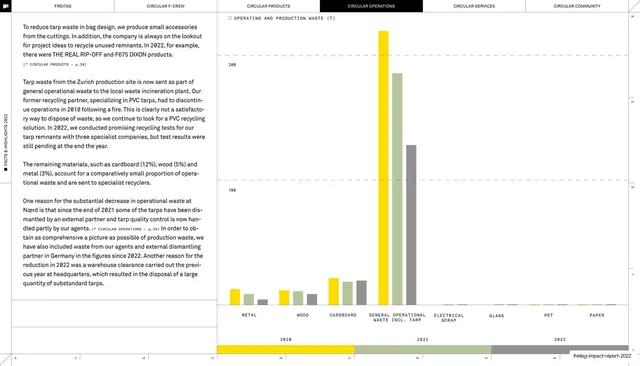
Operating and production waste bar chart

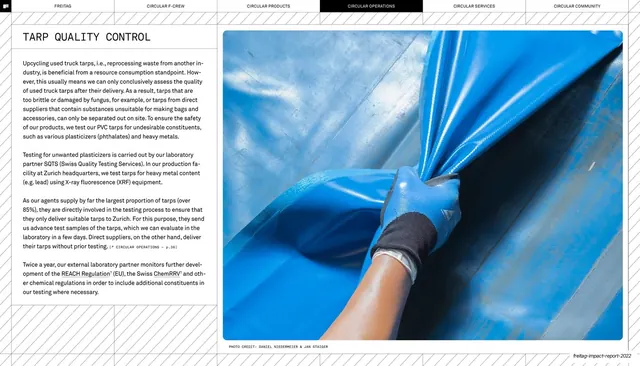
Tarp quality control photo spread

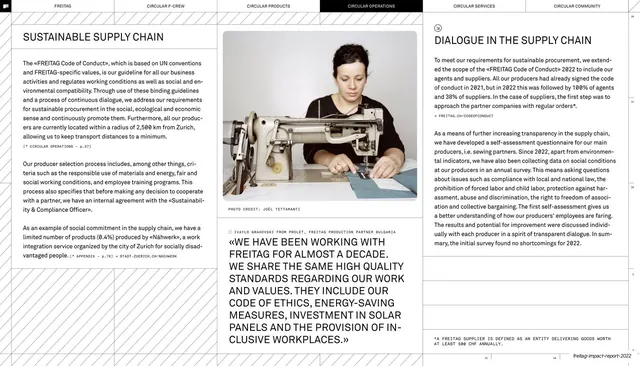
Sustainable supply chain quote spread

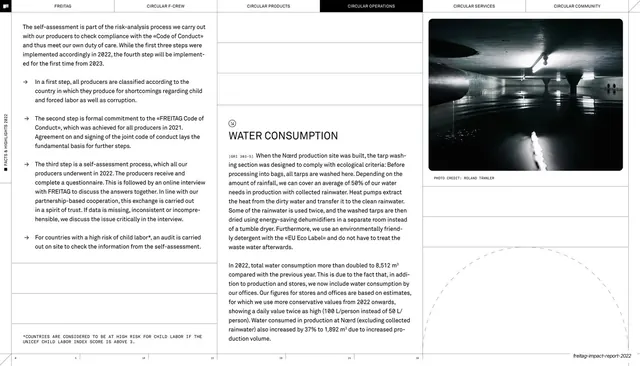
Producer self-assessment and water consumption

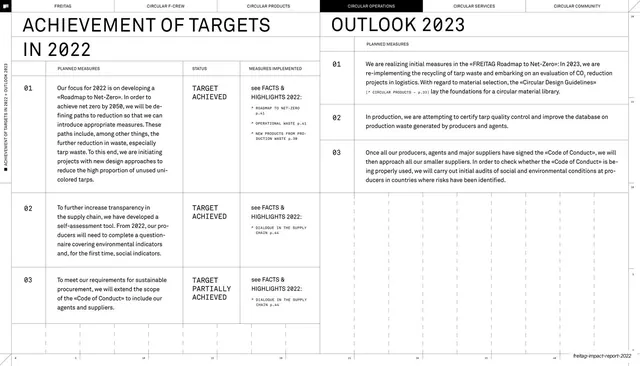
Achievement of targets and outlook table

Circular Services section divider

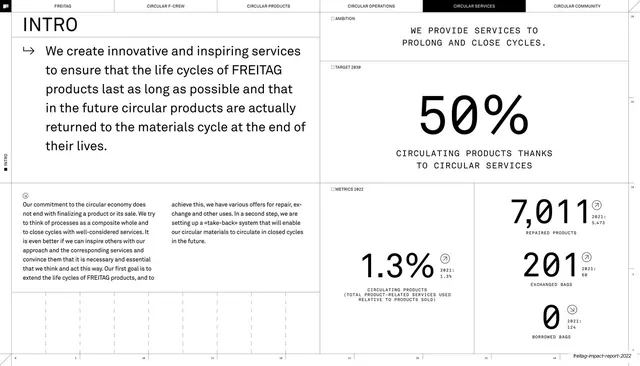
Circular services intro with metrics

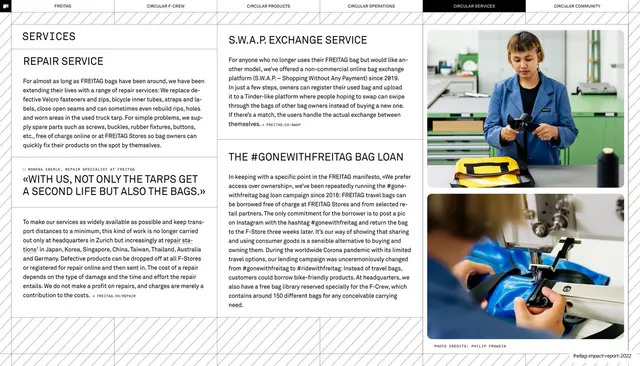
Repair and S.W.A.P. services photo spread

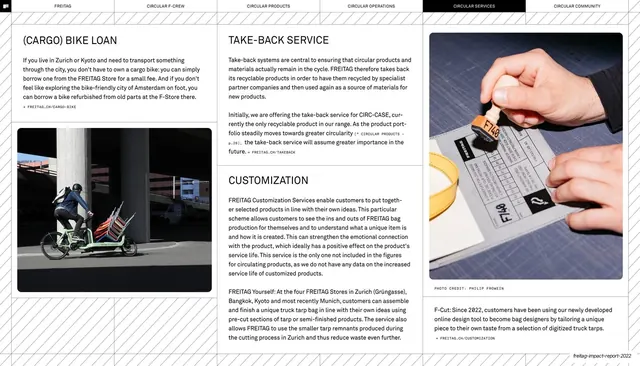
Bike loan, take-back and customization services

Repair station Munich facts and highlights

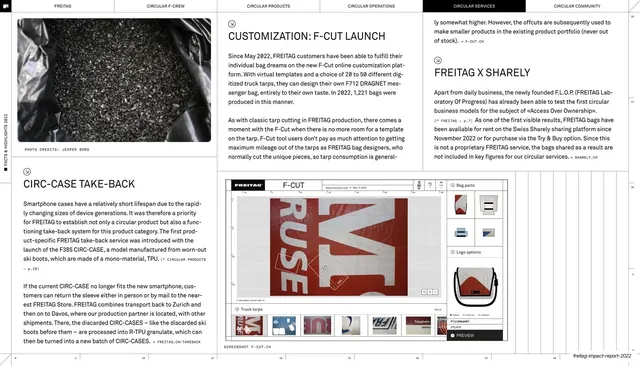
F-Cut customization launch screenshot spread

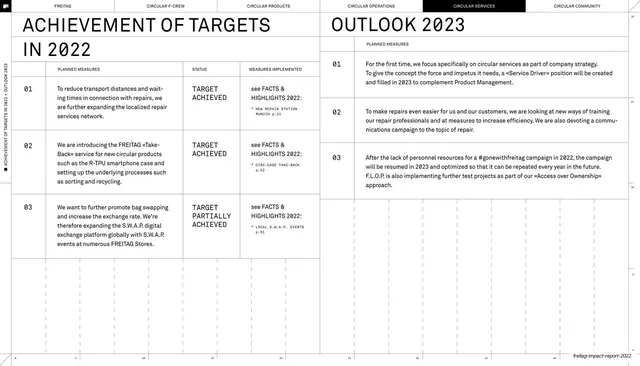
Achievement of targets and outlook (services)

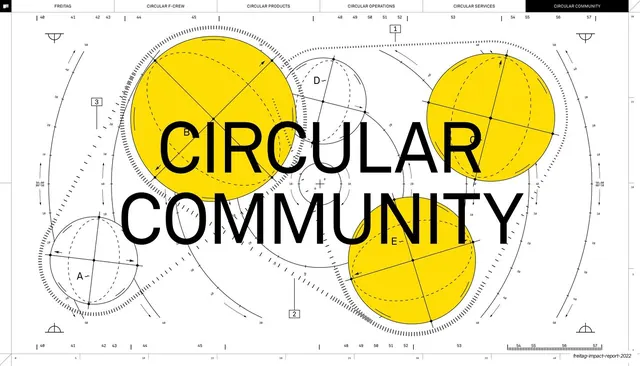
Circular Community section divider

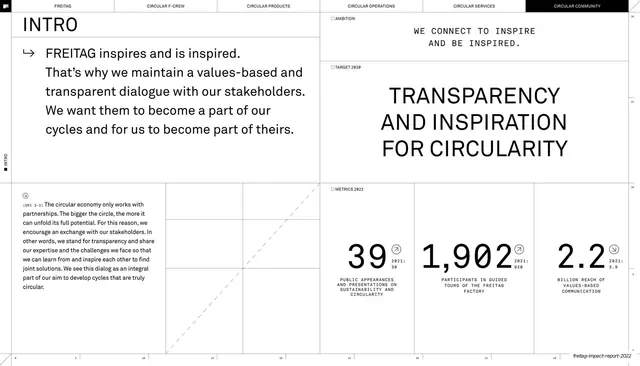
Transparency and inspiration for circularity

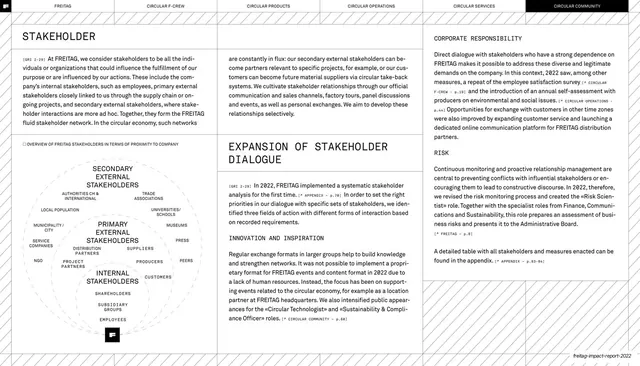
Expansion of stakeholder dialogue

Facts & highlights 2022, Nonprofit Fund Guidelines

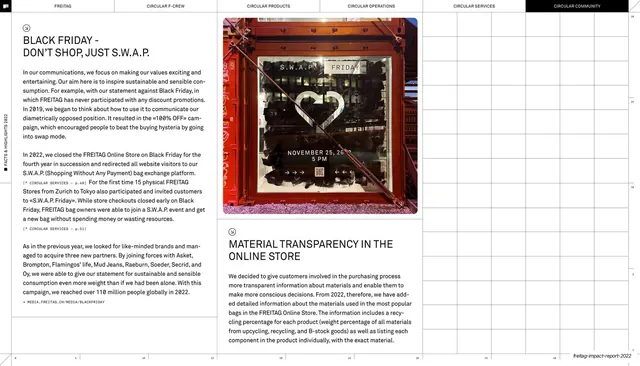
Black Friday S.W.A.P. and online-store transparency

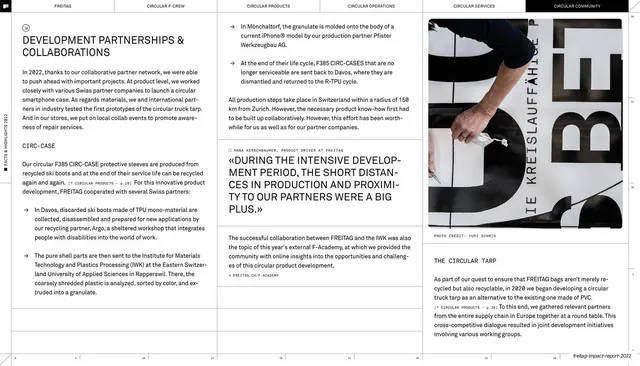
Development partnerships and collaborations

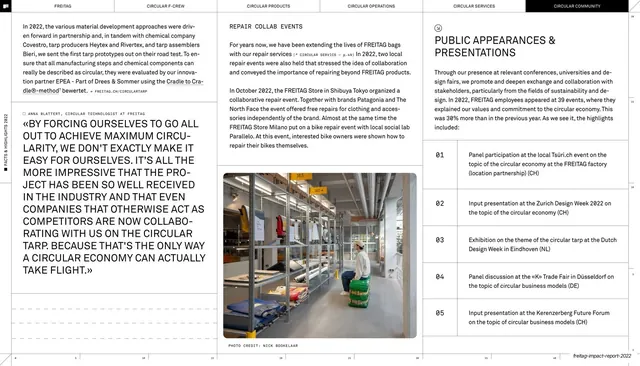
Public appearances and presentations

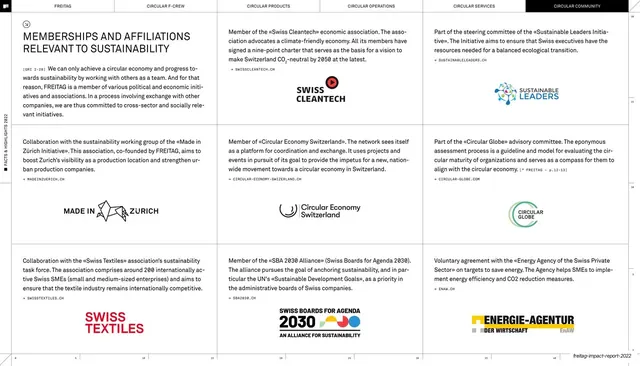
Memberships and affiliations logo grid

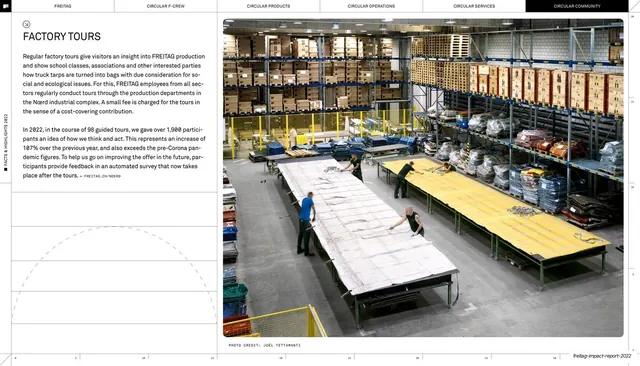
Factory tours

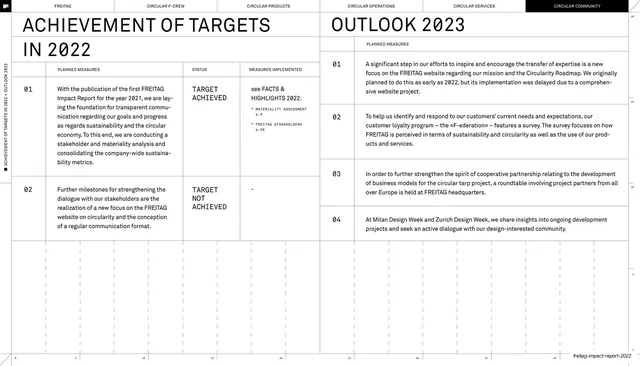
Achievement of targets 2022 and outlook 2023

Appendix section divider

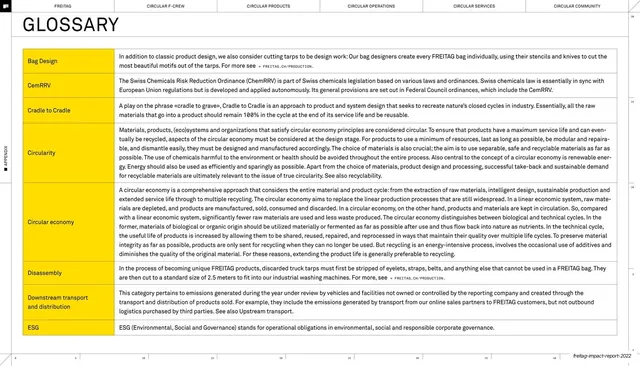
Glossary, terms A to E

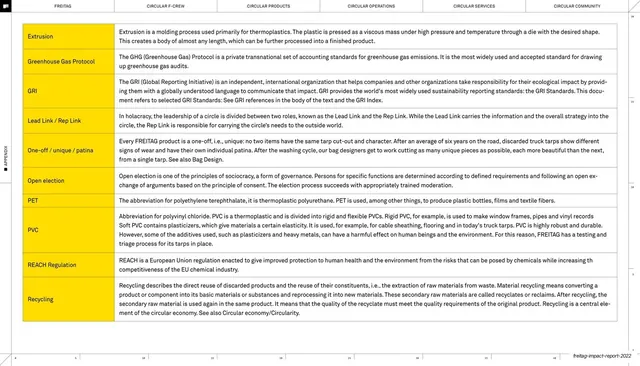
Glossary, terms E to R

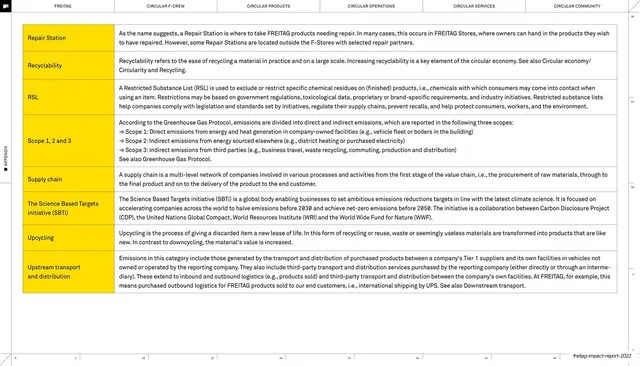
Glossary, terms R to U

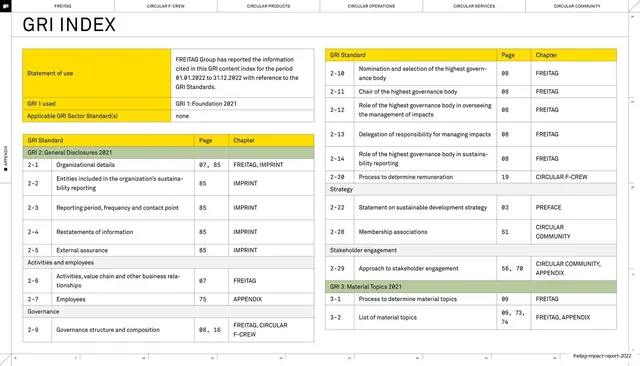
GRI index, general disclosures

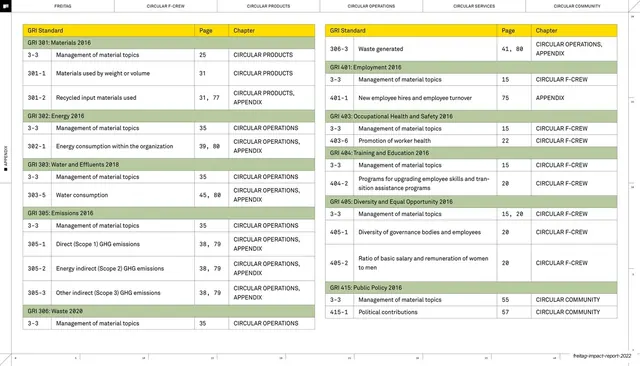
GRI index, topic standards

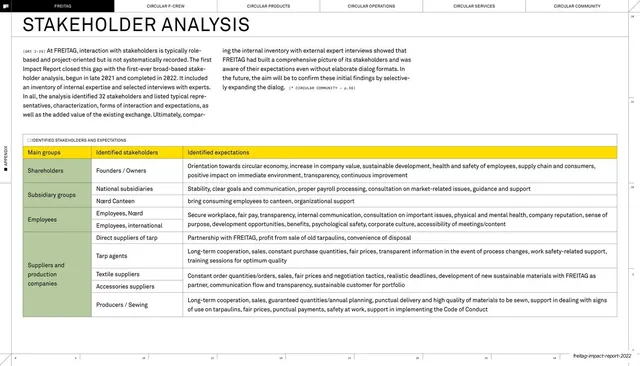
Stakeholder analysis table

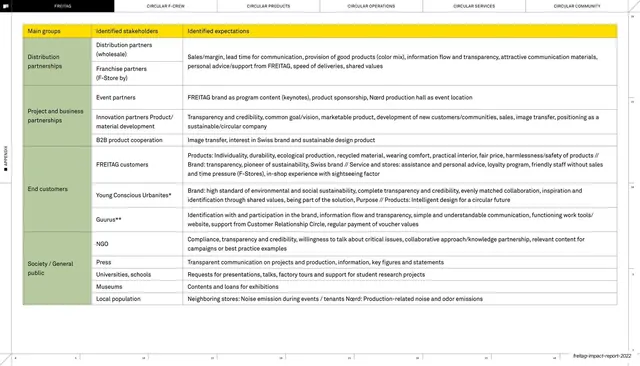
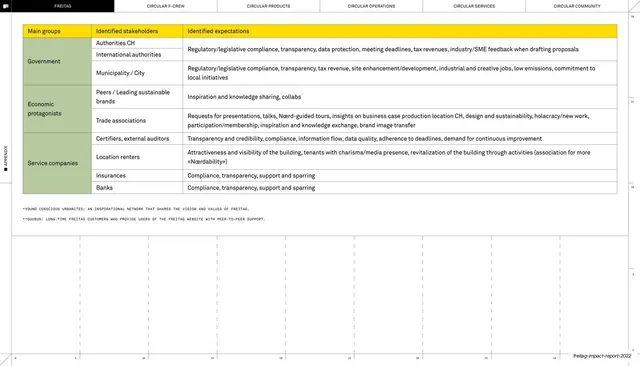
Stakeholder groups and expectations table

Government, industry and service stakeholders table

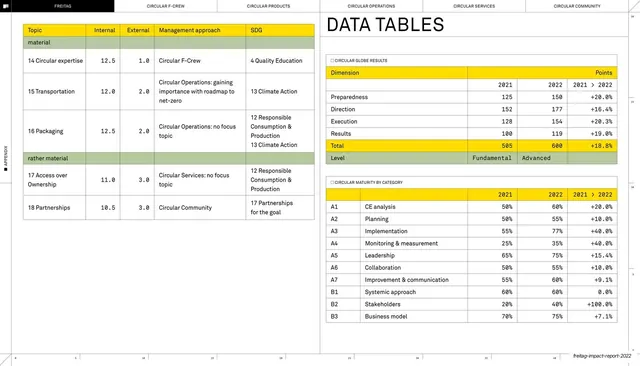
Materiality assessment ranked-topics table

Circular Globe results data tables

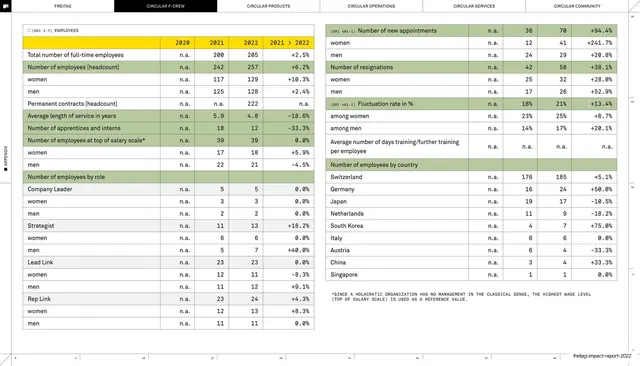
Employees headcount and country distribution table

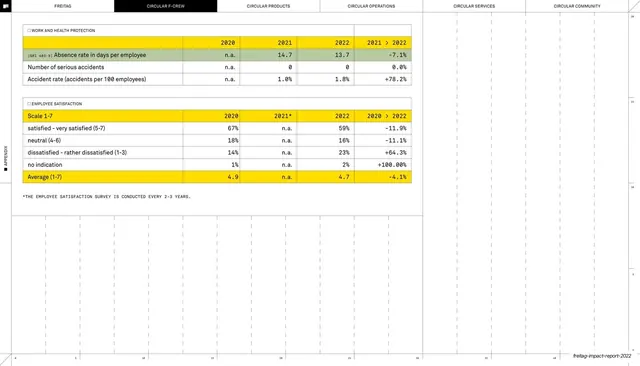
Health, accidents and satisfaction table

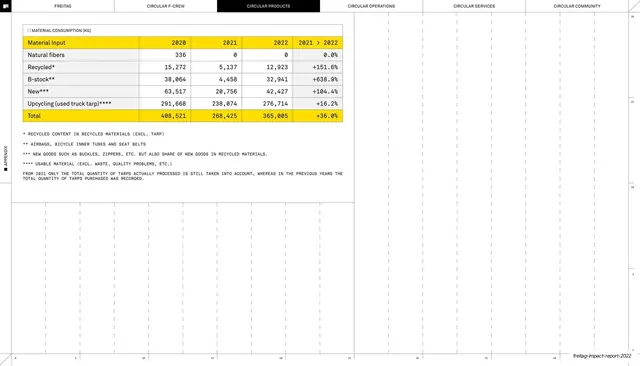
Material input and upcycling volumes table

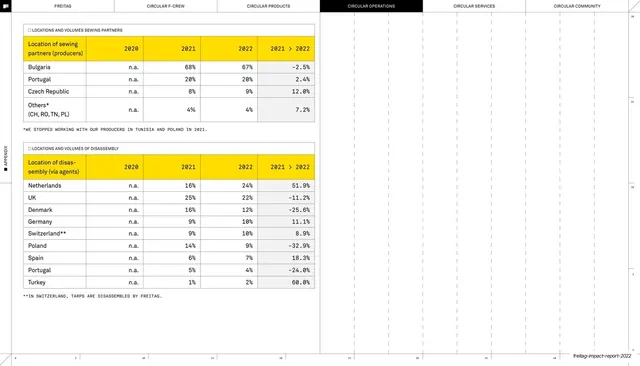
Sewing and disassembly partner locations table

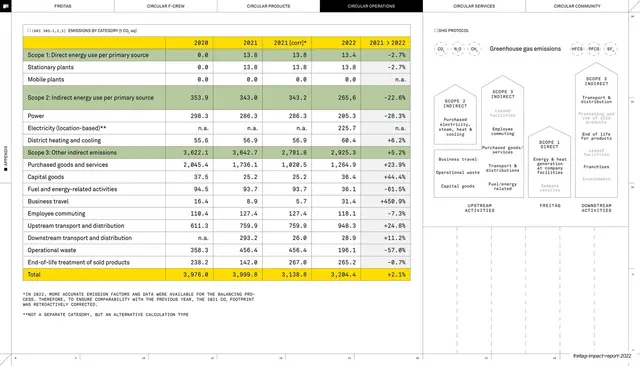
GHG emissions by scope with protocol diagram

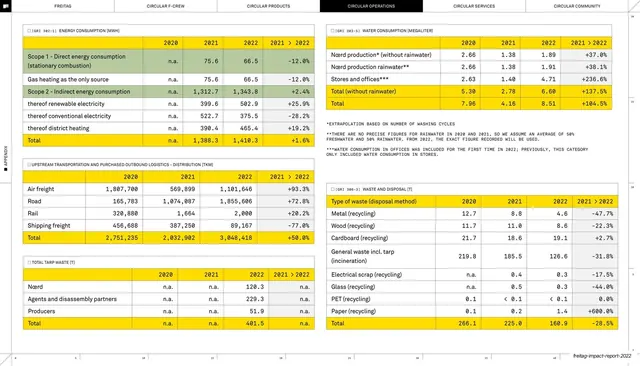
Energy, water, transport and waste metrics grid

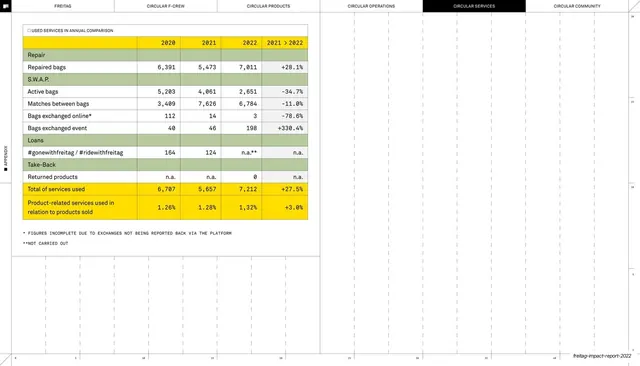
Used services annual comparison table

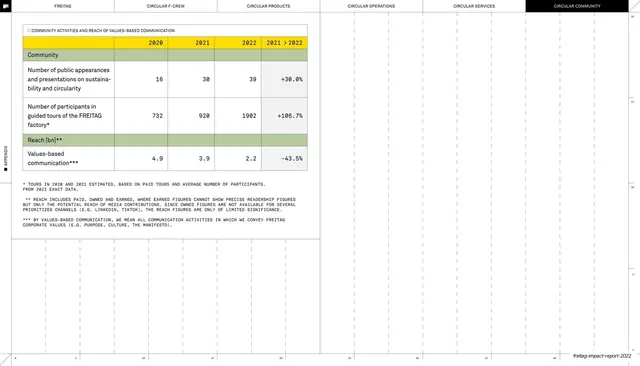
Community activities and reach table

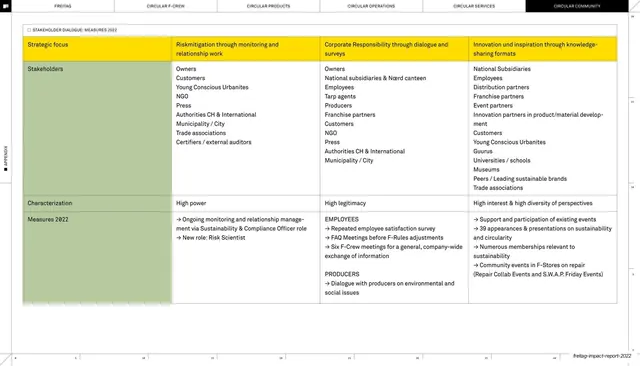
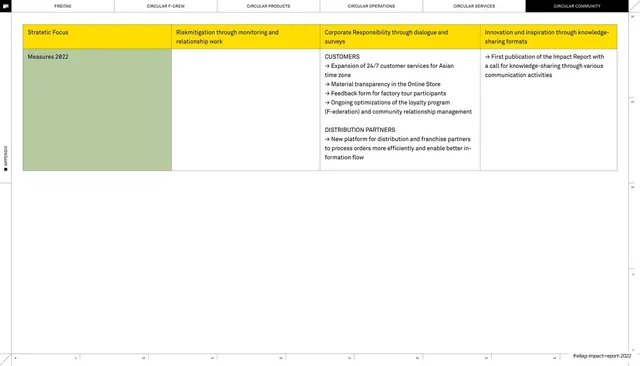
Stakeholder dialogue measures matrix

Stakeholder dialogue measures matrix continued

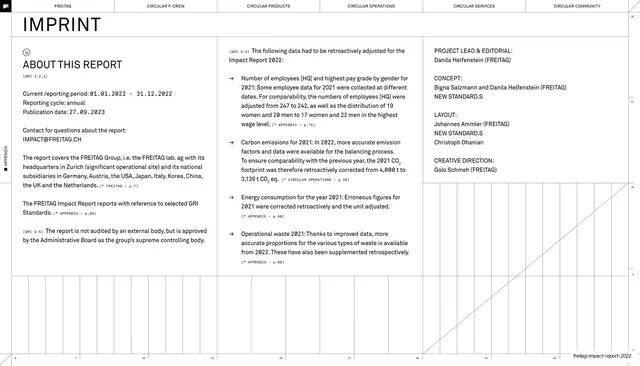
Imprint and about-this-report colophon

Impact Report back cover with technical grid