Preview image. Unlock full-res
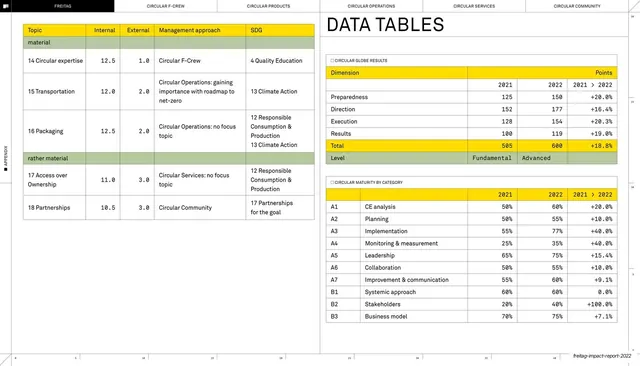
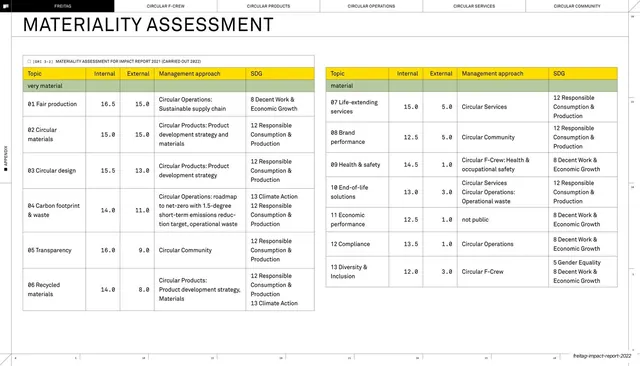
Appendix page pairing a continued materiality table with two Circular Globe maturity tables tracking 2021-to-2022 change in monospace figures.
Summary
An appendix data page: the materiality table continues on the left, and two "DATA TABLES" on the right report Circular Globe results and category maturity scores with year-over-year change columns.
Visual description
Same white ground with faint dotted grid, right-edge ruler scale, rotated "APPENDIX" tab and fixed six-tab header (none highlighted). The left third continues a yellow-headed materiality table (topics 14 to 18). The right two-thirds is titled "DATA TABLES" in oversized all-caps sans and holds two stacked tables: "Circular Globe results" (Preparedness, Direction, Execution, Results, Total, Level) and "Circular maturity by category" (A1 to B3 dimensions), each with 2021, 2022, and a "2021 > 2022" delta column in monospace numerals, percentage changes, and a yellow total row. A running footer carries the deck slug at right.
Key takeaway
The explicit "2021 > 2022" delta column that puts change next to the raw figures, so improvement is readable at a glance without a chart. Reusing one yellow header / yellow total band across every table on the page keeps a dense scorecard calm and scannable.
Reuse notes
Good reference for a maturity or assessment scorecard in a report appendix, where many small metrics need consistent column structure. The labelled delta column is directly reusable for any before/after data set. Carries best alongside the other tabular appendix pages in this deck.
From this deck: Circular Globe results data tables
View deck



More like this






Keep what you find
A free account saves references to boards and can send you a weekly email of picks based on what you save.
To see every result, go Pro.