Preview image. Unlock full-res
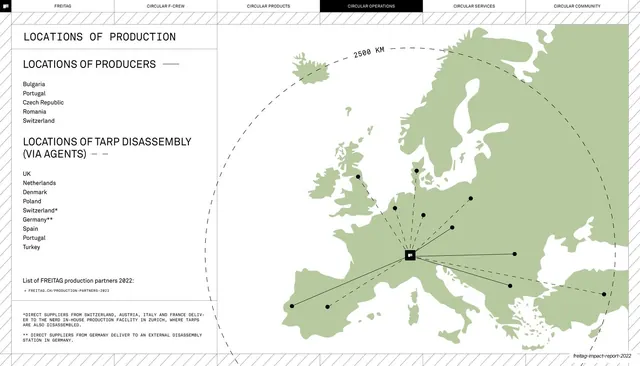
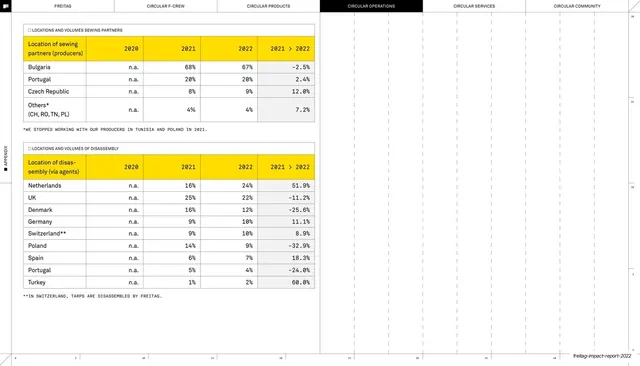
Two-column spread pairing a list of producer and tarp-disassembly countries with a green silhouette map of Europe showing supply routes inside a 2500 km radius.
Summary
A two-column production-locations spread: a left text column lists producer and disassembly countries while a large olive-green silhouette map of Europe on the right plots routes radiating from a central Zurich marker inside a dashed 2500 km circle.
Visual description
A thin six-tab running header sits across the top (FREITAG, CIRCULAR F-CREW, CIRCULAR PRODUCTS, CIRCULAR OPERATIONS in inverted black, CIRCULAR SERVICES, CIRCULAR COMMUNITY) on hatched hairline rules. The left third is white: a heading "LOCATIONS OF PRODUCTION", then two all-caps subheads ("LOCATIONS OF PRODUCERS", "LOCATIONS OF TARP DISASSEMBLY (VIA AGENTS)") each set off by a short dash, with plain country lists beneath and small monospace footnotes at the bottom. The right two-thirds is a flat pale-green silhouette of Europe with black dots on producer cities, solid and dashed black lines fanning out from a small black FREITAG mark near Switzerland, and a hand-drawn dashed arc labelled "2500 KM". A running footer with the deck slug sits bottom-right.
Key takeaway
Using one flat fill-color map with no borders or labels, then letting thin black radial lines and a single hand-labelled radius arc carry all the meaning. The split of a calm typographic list against a quiet info-graphic keeps a logistics topic legible.
Reuse notes
A strong template for any sourcing, supply-chain, or coverage-area slide that needs to show "where" without a busy GIS map. Works for reports and B2B operations decks. Needs a clean single-color map asset and a defined hub point to anchor the routes.
From this deck: Locations of production map
View deck

More like this


Keep what you find
A free account saves references to boards and can send you a weekly email of picks based on what you save.
To see every result, go Pro.