Preview image. Unlock full-res
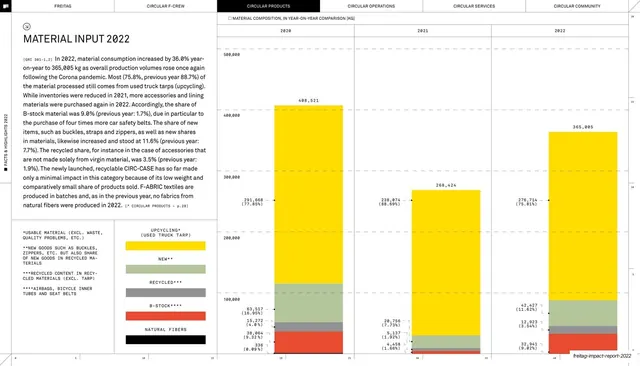
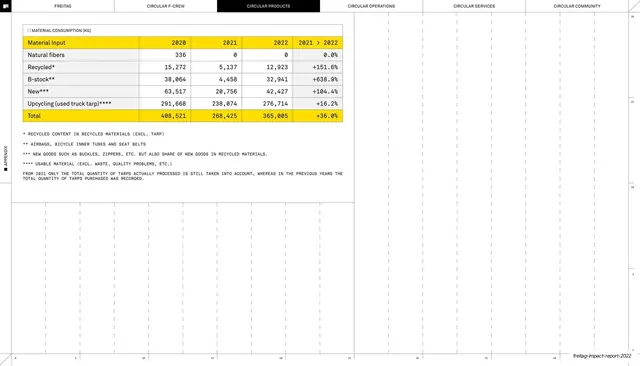
Circular Products appendix table breaking material consumption in kilograms into fibres, recycled, B-stock, new and upcycled tarp from 2020 to 2022.
Summary
A Circular Products appendix page with a single material-consumption table in kilograms, splitting input into natural fibres, recycled, B-stock, new goods and upcycled truck tarp, plus a year-over-year delta and footnotes.
Visual description
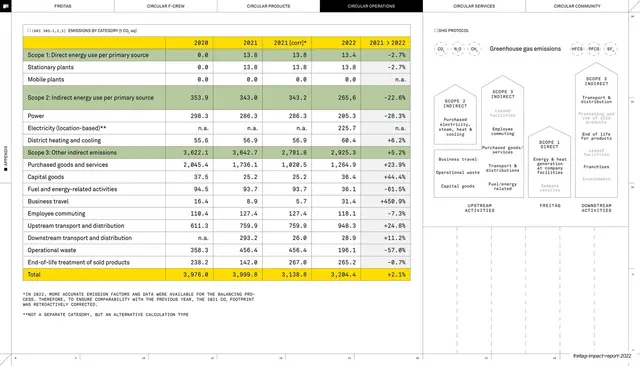
White ground, faint dotted grid, right-edge ruler, rotated "APPENDIX" tab; the six-tab header shows CIRCULAR PRODUCTS in a black pill. A single "MATERIAL CONSUMPTION [KG]" table sits top-left, right-aligned monospace numerals in 2020, 2021, 2022 and a "2021 > 2022" percent delta column. Rows: Natural fibers, Recycled, B-stock, New, Upcycling (used truck tarp), and a bright yellow Total row. Four asterisked footnotes beneath define each category in all-caps monospace; the lower-right of the page is empty, showing the dotted grid. The running footer carries the deck slug.
Key takeaway
Right-aligning every figure to a monospace grid so thousands separators line up cleanly, and reserving the only saturated color for the header and Total rows. The asterisk footnotes let dense category definitions live under the table without cluttering the rows.
Reuse notes
A clean pattern for any single-table data page where definitions matter as much as numbers, for example materials, emissions, or financial line items. The footnote convention is reusable wherever rows need caveats. Keep the active-tab header and dotted grid to stay consistent with the rest of the appendix.
From this deck: Material input and upcycling volumes table
View deck