Preview image. Unlock full-res
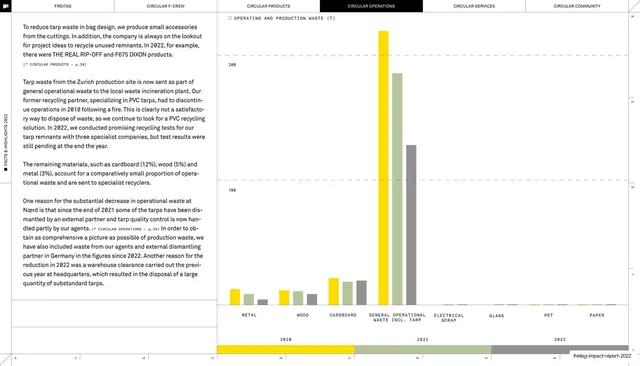
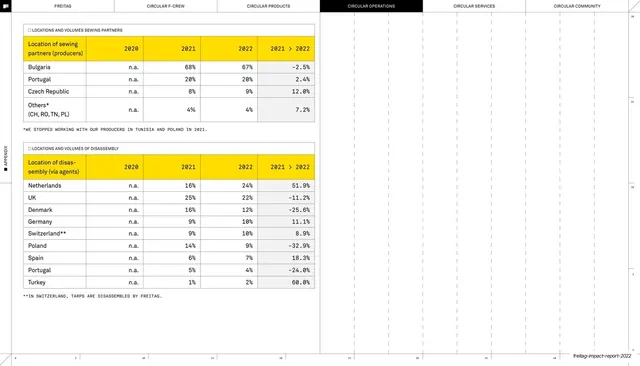
Circular Operations appendix with two stacked tables giving the location and volume share of sewing partners and disassembly agents by country from 2020 to 2022.
Summary
A Circular Operations appendix page with two stacked tables giving the percentage of sewing-partner and disassembly-agent volume by country, tracked across 2020 to 2022.
Visual description
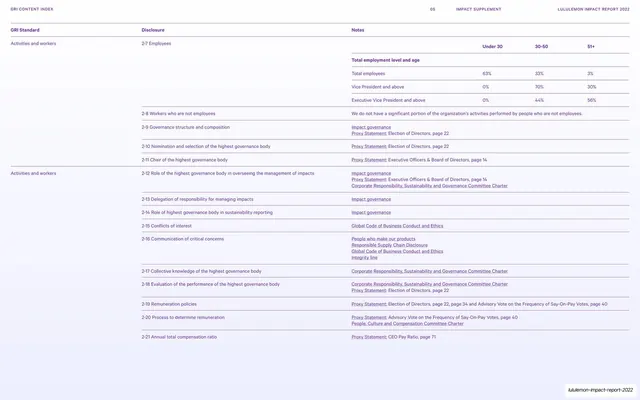
White ground, faint dotted grid, right-edge ruler, rotated "APPENDIX" tab; the six-tab header shows CIRCULAR OPERATIONS in a black pill. Upper-left, a "LOCATIONS AND VOLUMES SEWING PARTNERS" table lists Bulgaria, Portugal, Czech Republic and Others with percentage shares and a "2021 > 2022" delta; an asterisk footnote sits beneath. Below it, a longer "LOCATIONS AND VOLUMES OF DISASSEMBLY" table runs Netherlands, UK, Denmark, Germany, Switzerland, Poland, Spain, Portugal and Turkey with the same column structure, plus a second footnote. All figures are monospace, 2020 columns showing "n.a." A yellow header row tops each table; the lower-right page is empty grid. The running footer carries the deck slug.
Key takeaway
Expressing a geographically distributed supply chain as a simple percentage-by-country table rather than a map, which keeps it precise and comparable year over year. Two stacked tables sharing identical columns make sewing and disassembly directly legible against each other.
Reuse notes
A good reference for sourcing or supply-chain transparency pages where location share matters. The repeated column template across stacked tables is reusable for any paired data sets that must be read in the same frame. Consistent with the deck's other operations tables; keep the dotted grid and tab header.
From this deck: Sewing and disassembly partner locations table
View deck