Preview image. Unlock full-res
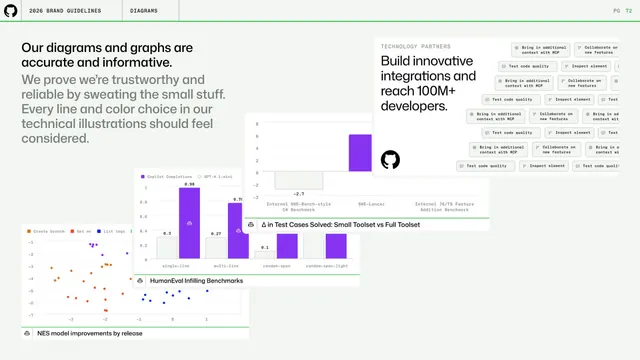
Diagrams intro arguing charts should be accurate and considered, shown through several overlapping benchmark charts and a tech-partners tag card.
Summary
The diagrams chapter opener stating that GitHub's charts and graphs should be accurate and considered, illustrated with a loose collage of real benchmark charts and a partner tag card.
Visual description
A left headline ("Our diagrams and graphs are accurate and informative.") sits over a gray paragraph about sweating the small stuff in technical illustrations. The right two-thirds layers several overlapping white chart cards at slight offsets: a scatter plot ("NES model improvements by release"), two grouped bar charts ("HumanEval Infilling Benchmarks" and "Δ in Test Cases Solved") using purple and gray bars with a small copilot mark, and a "TECHNOLOGY PARTNERS / Build innovative integrations" card filled with small monospace pill tags. Off-white background with the standard header and green rule above.
Key takeaway
Selling chart quality with a collage of genuine, specific, labeled charts (real metric names, restrained two-color bars) rather than dummy graphics, signaling that data design is taken seriously.
Reuse notes
A good opener for a data-visualization section. The overlapping-cards arrangement previews variety (scatter, bar, tag list) while the single purple accent keeps the busy collage coherent.
From this deck: GitHub guidelines - accurate diagrams and graphs
View deck