Preview image. Unlock full-res
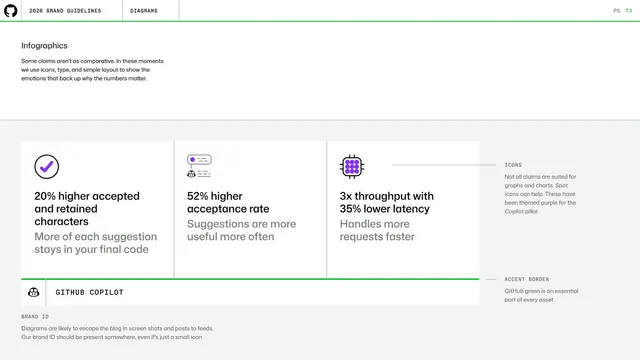
Infographics page showing three stat callouts built from spot icons, big numbers and a green accent border, branded with a Copilot eyebrow.
Summary
An infographics page demonstrating how to present non-comparative claims using a spot icon, an oversized stat and a short label per item, set in a three-up row with a green accent border and Copilot brand ID.
Visual description
A left intro explains that some claims aren't comparative, so icons, type and simple layout convey why the numbers matter. The body is a wide light-gray panel split into three stat cells, each with a purple-accented spot icon on top, an oversized black figure ("20% higher accepted and retained characters", "52% higher acceptance rate", "3x throughput with 35% lower latency") and a muted support line. A green accent bar runs along the bottom with a "GITHUB COPILOT" monospace label and copilot mark. Right-margin notes call out ICONS (themed purple for the Copilot pillar) and ACCENT BORDER (GitHub green on every asset). Standard header and green rule above.
Key takeaway
A repeatable stat-callout module: spot icon, big number, one-line gloss, times three, anchored by an accent border and a brand-ID strip so even a marketing infographic stays unmistakably on-brand.
Reuse notes
Ideal for slides or social posts that need to land metrics without charts. The icon-plus-number-plus-label cell and the green accent-border-with-brand-ID footer are easy to reuse across topics and pillars.
From this deck: GitHub guidelines - infographics with icons and type
View deck













More like this




Keep what you find
A free account saves references to boards and can send you a weekly email of picks based on what you save.
To see every result, go Pro.